Saddles 100 An installation for an ultramarathon.
Field
A projected wall built from the race's data, and a scanner at the finish that reads your bib and pulls up your race data.
Overview
The Saddles 100 is an ultramarathon in Prescott. I built two things for it: a TouchDesigner data visualization projected at the finish line, and an interactive display that uses a screen and camera to scan runners' bibs and load a sci-fi interface card they can download at a hosted URL.
I've been learning TouchDesigner for a few years now, mostly for audio-reactive concert visuals. This pushed me into a new zone: creating a somewhat immersive environment, pulling in data for over 300 runners, and updating it live throughout the race so spectators at the finish line could stay updated. My part was the wall, the scanner, the cards, and the code.
Scenes in the wall loop, seamless
Race distances: 100, 50, and 6.66 miles
Loop runtime, built to play from a USB stick
Runners' data, updated through the race
As run, October 2026
The wall
A projected loop for the finish area, indigo on black with a CRT treatment, built from the race's own data: the elevation model, the GPX routes, the entrant list, then the results. Thirty-six scenes over nine and a half minutes.
The look comes straight from the race's theme: CRT scanlines, radar sweeps, classified-looking reports. I built it in TouchDesigner and vibe coded the Python pipeline with Claude Code: fetching elevation data, baking routes, merging the start list.
On race night it's just a video file playing off a USB stick. No network, no laptop to fall asleep, nothing to crash.
Scene 14 is a Borges quote about a labyrinth that consists of a single straight line.
The console
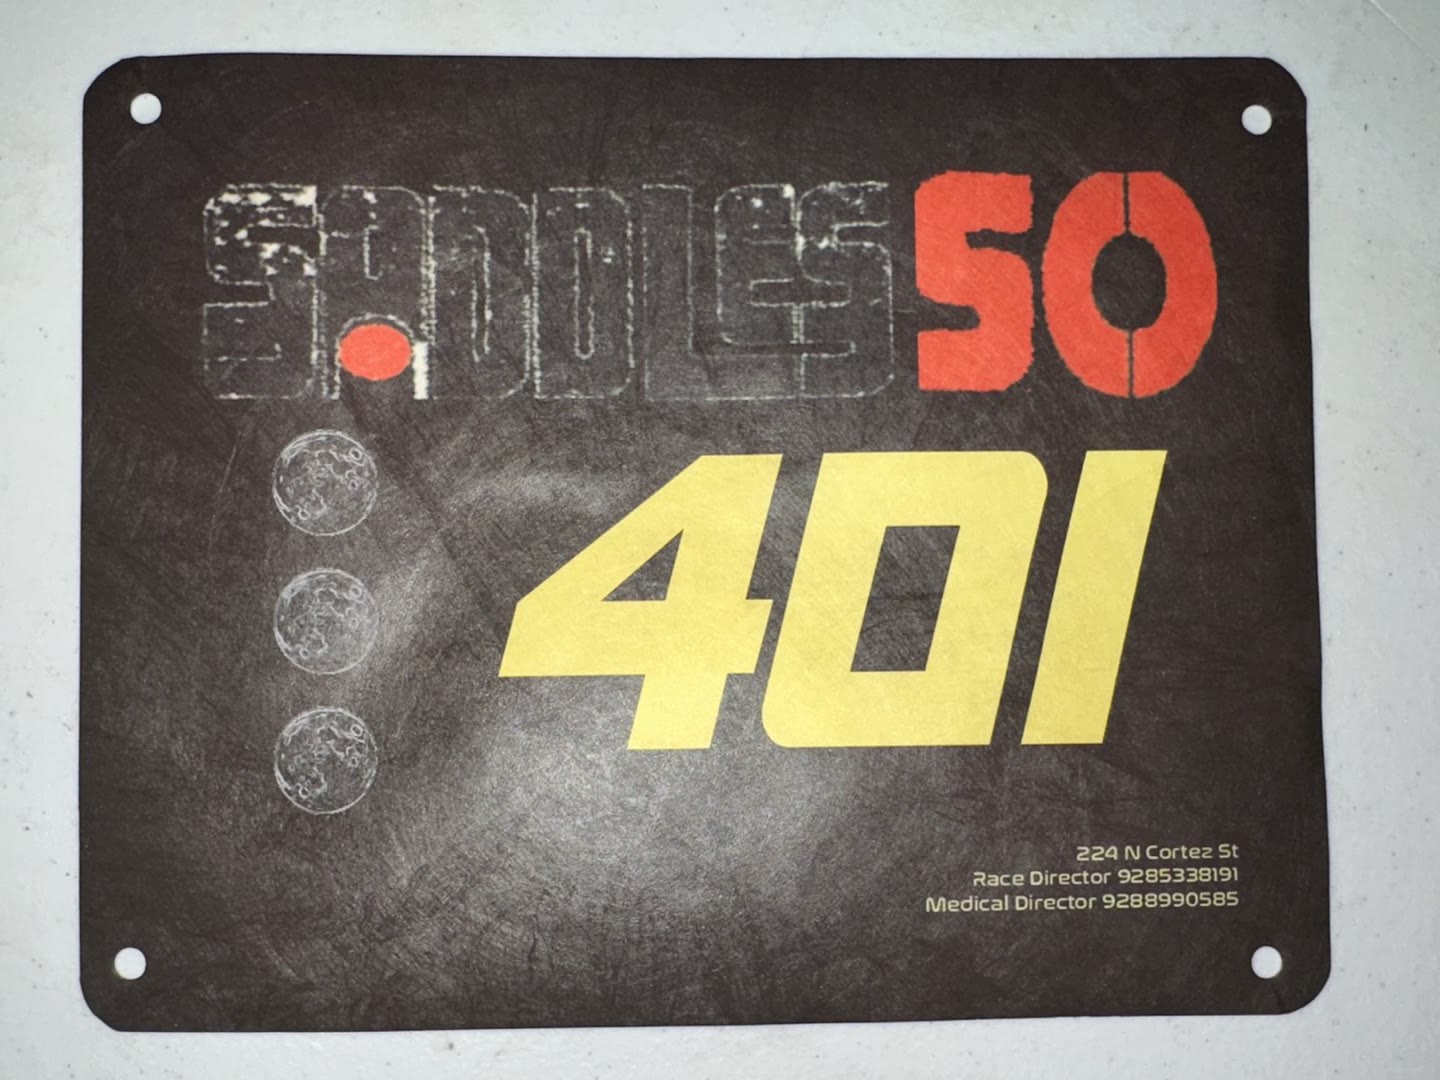
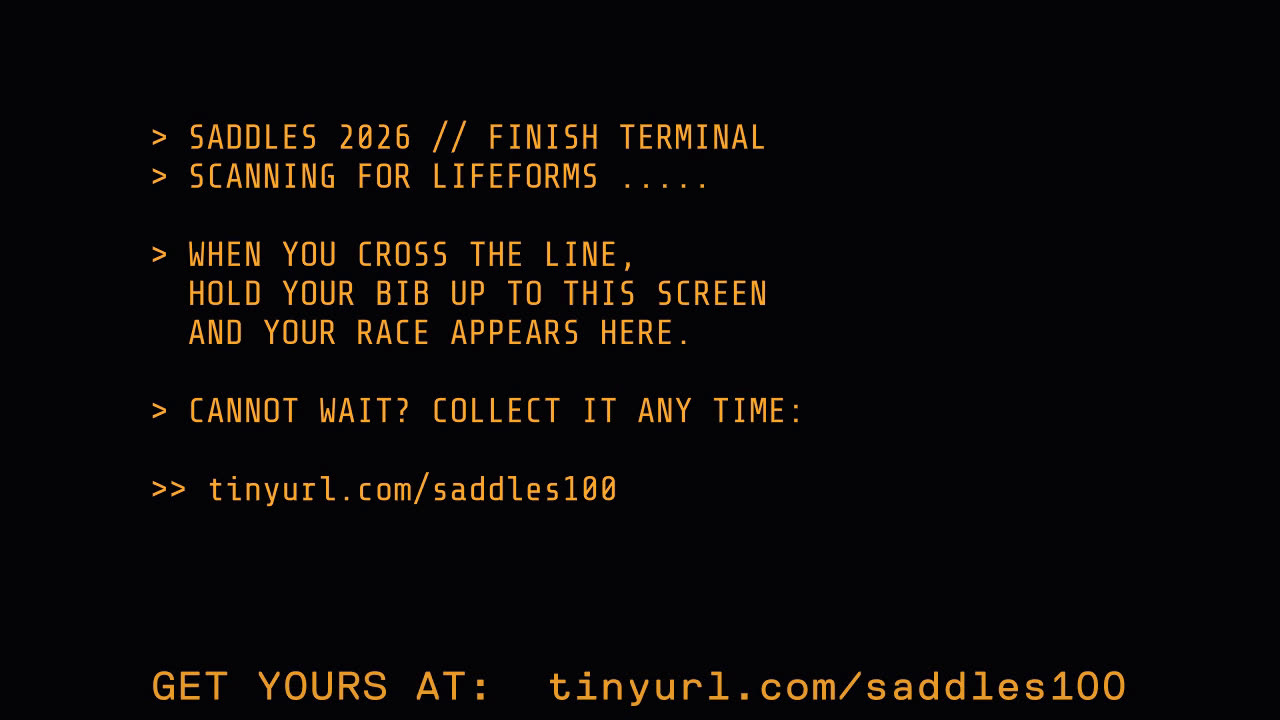
A TV at the finish with a camera on top. It scans a runner's bib and loads their sci-fi interface card, which they can download at a hosted URL and keep. Before the race the card had their stats from UltraSignup; after, their results: split times at the aid stations, place in the race.
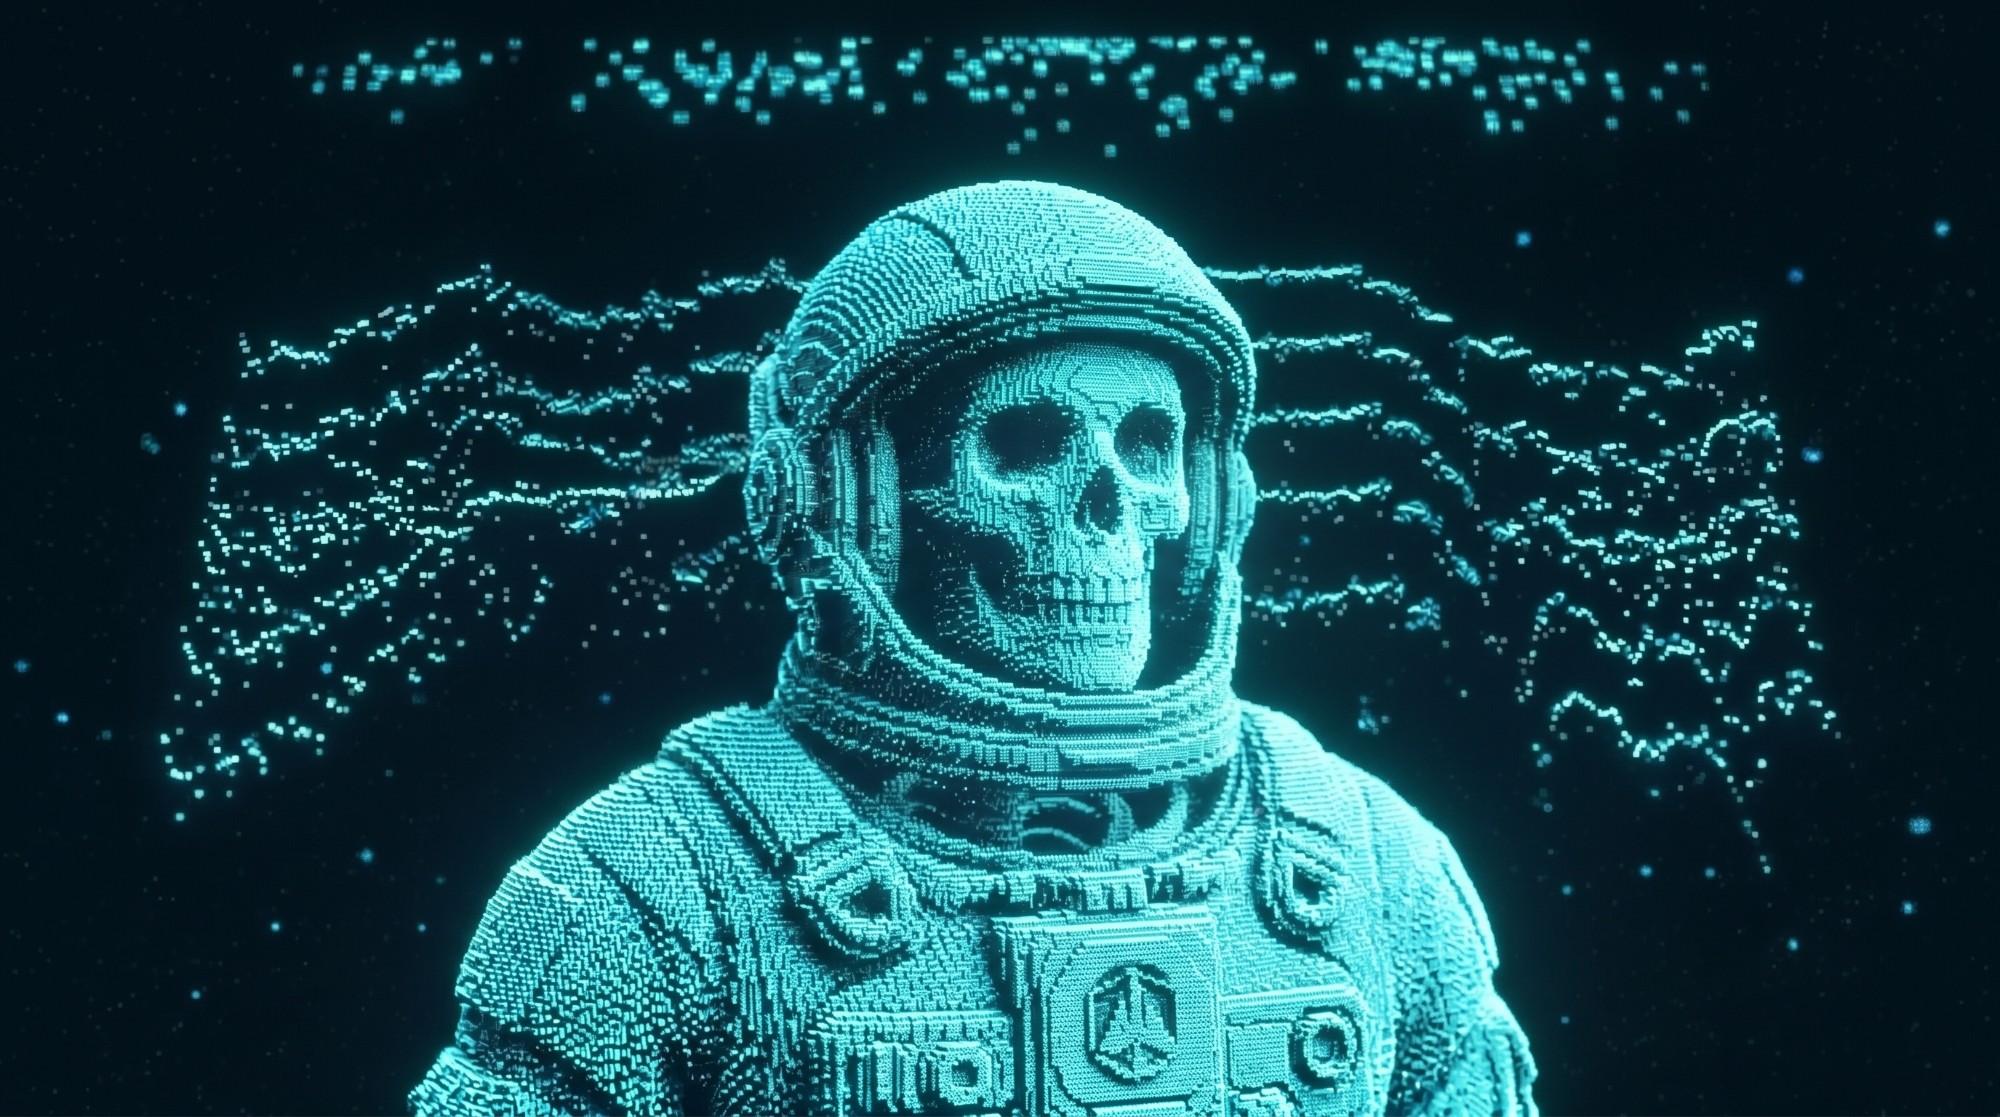
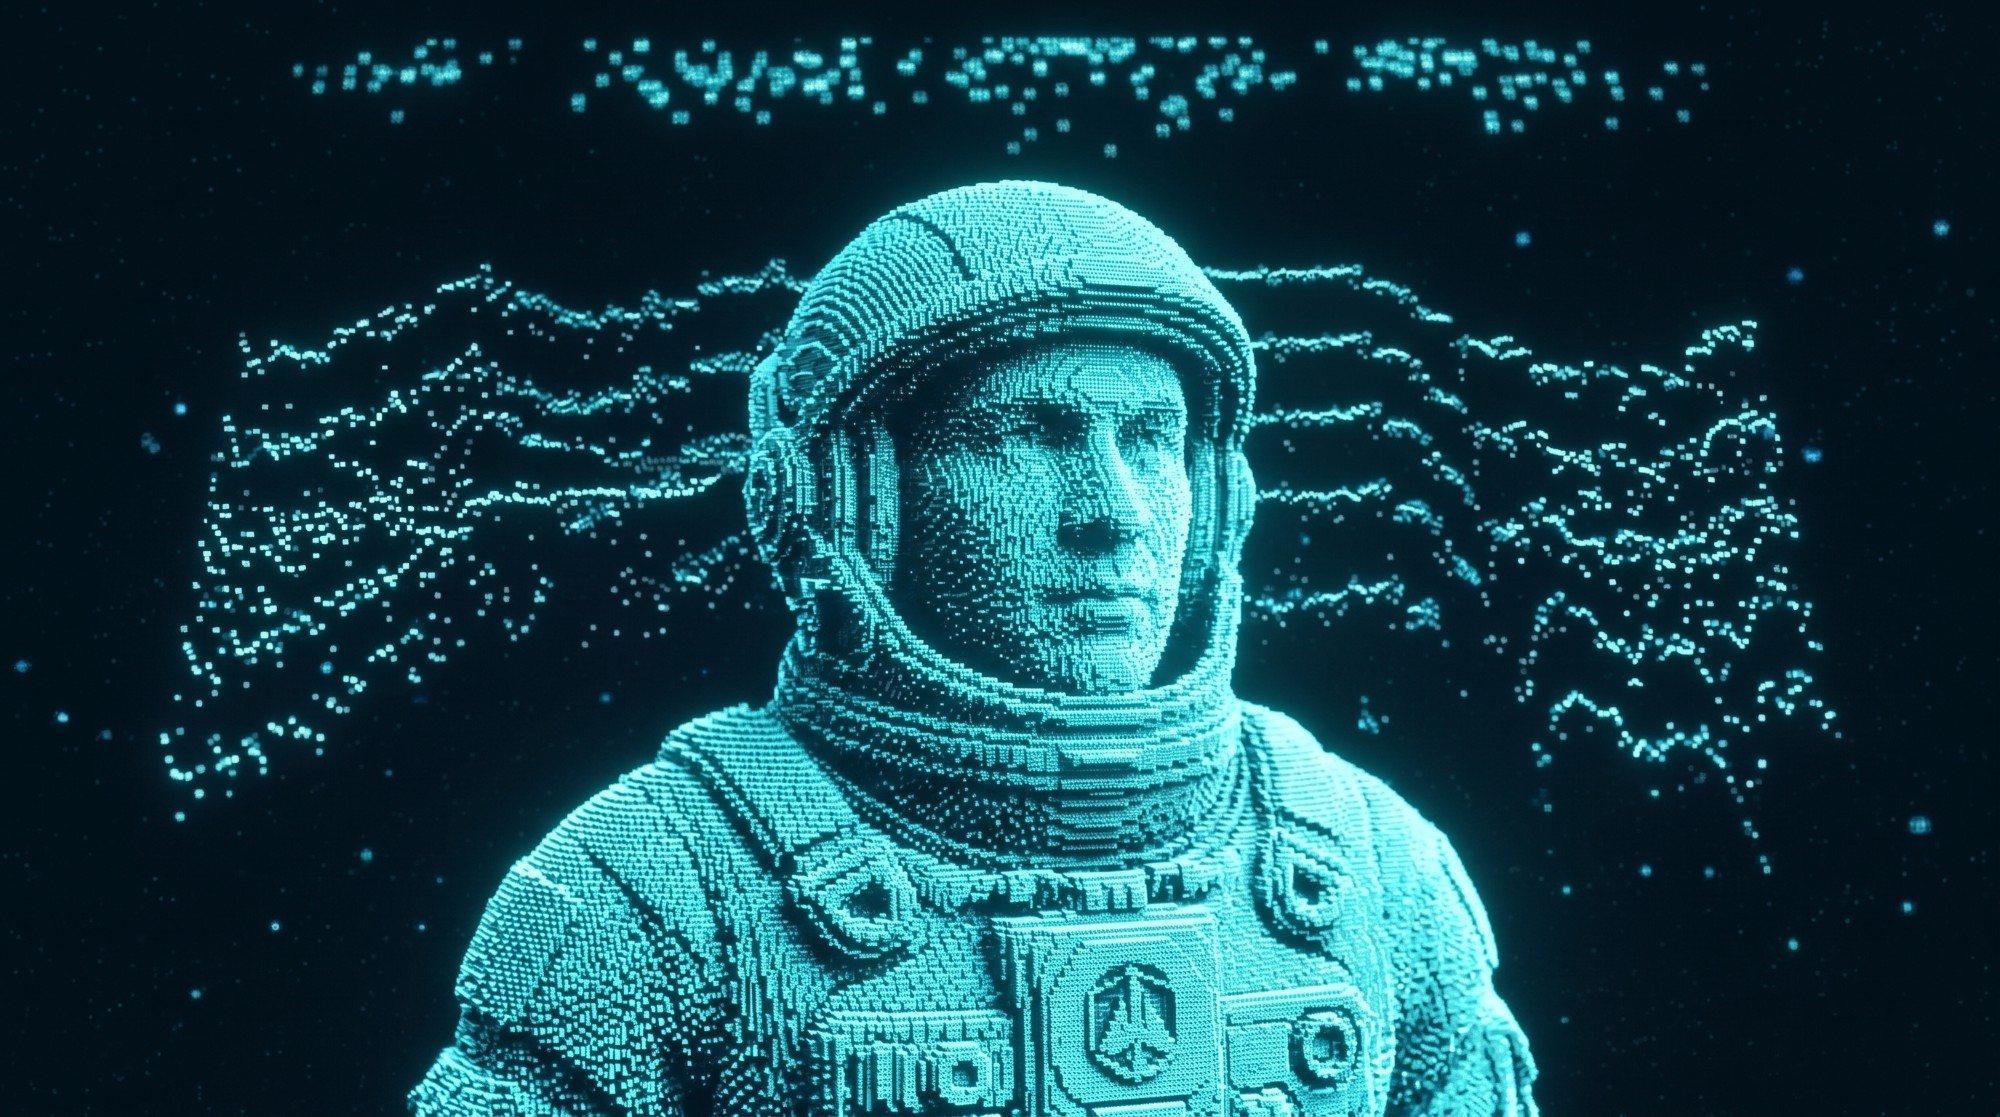
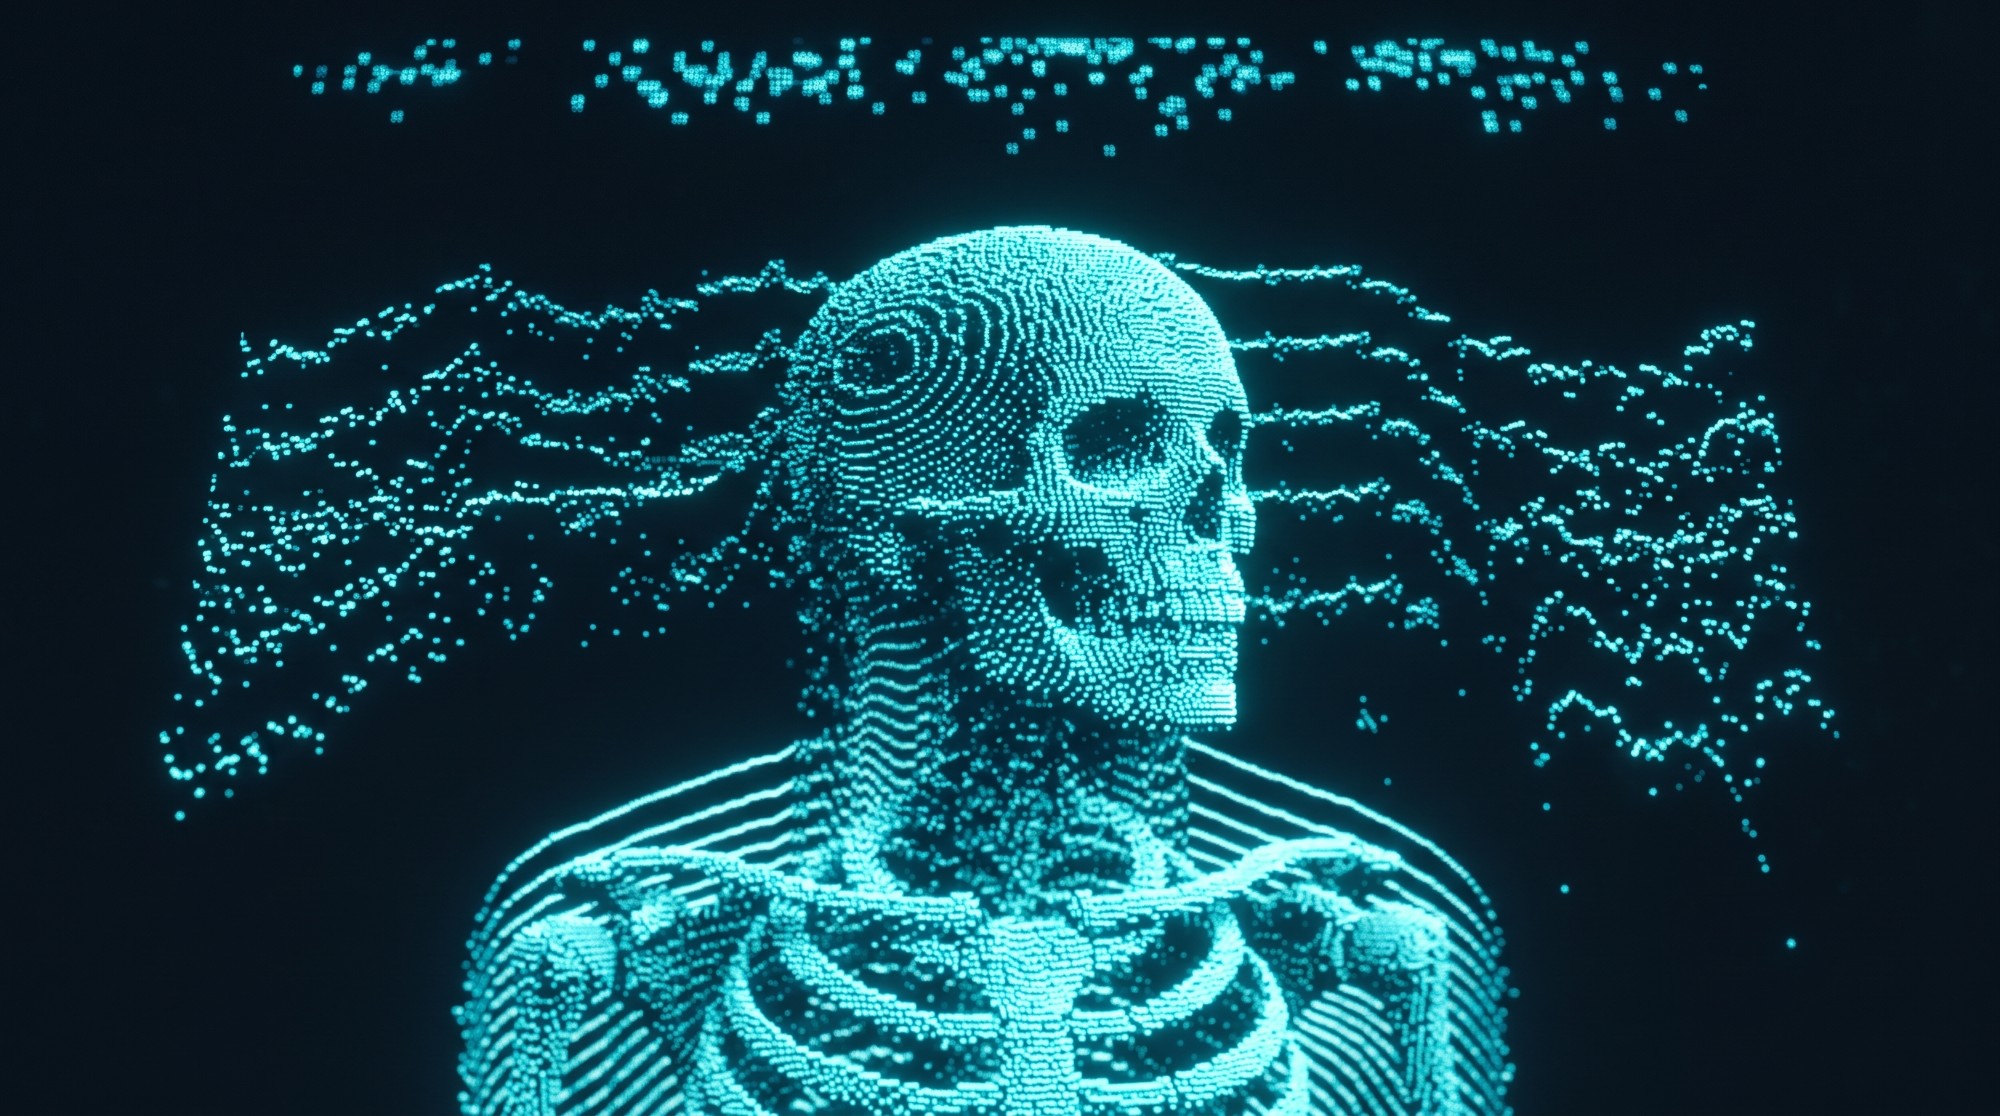
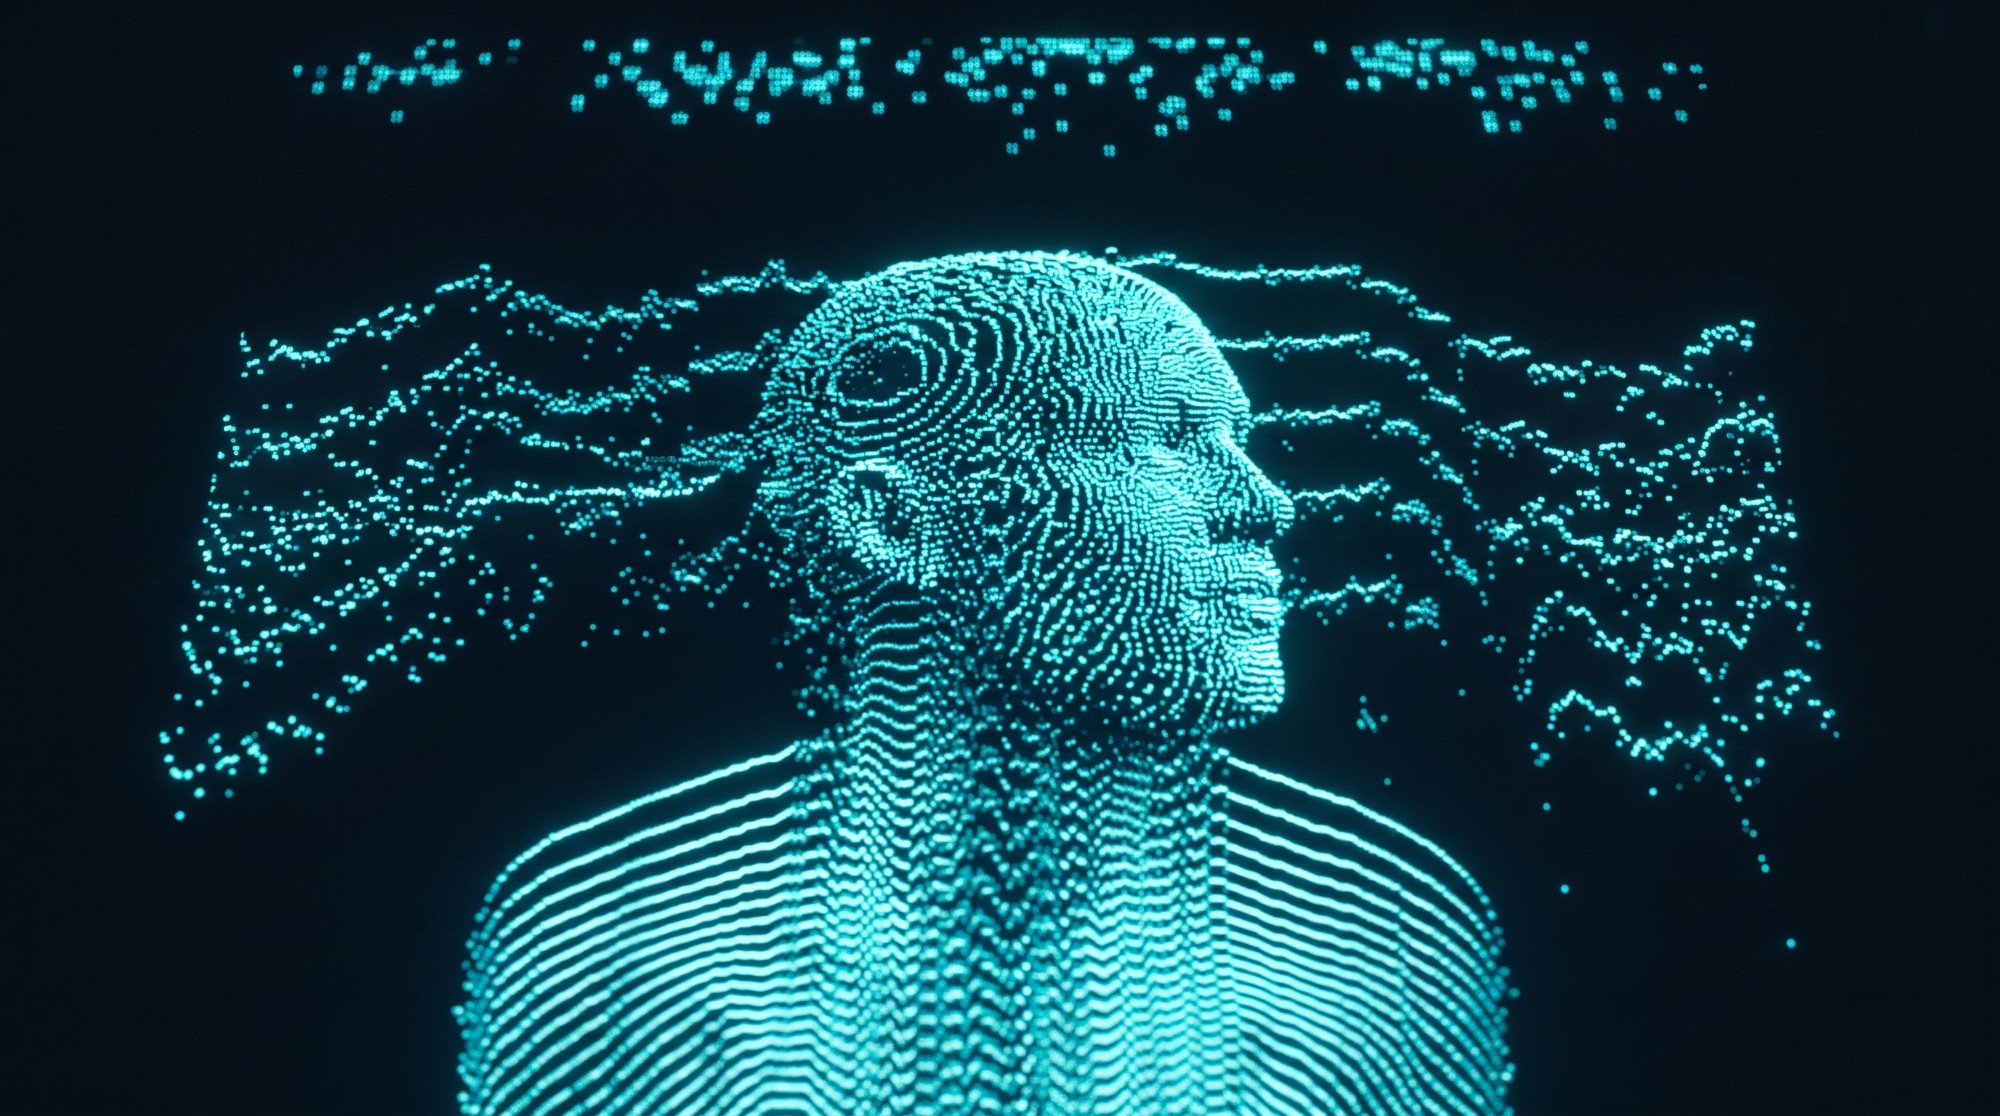
If there were errors in the scan, runners could also just go to the URL and type their bib number. The URL is printed on the screen the whole time.
The card leans into the race's horror and sci-fi theme: your splits drawn as terrain, your name and number in the race's numerals. Everyone who finishes gets one.
The data
Before the race, everything ran on UltraSignup data: who was coming, what they'd run before. The wall's entrant scenes and the early cards came from that.
After the race, the official results took over: finish times, places, split times at the aid stations. The same card at the same URL updated with what happened.
Field notes
-
The USB stick is the uptime strategy
No laptop to sleep, no app to crash, no cable to kick.
-
Fix it from your side of the lens
The bibs were already printed, so every scanning fix had to come from my side: the code, the lighting, or what the screen asked people to do.
-
Out of the comfort zone
This was my first installation. On the web I know where things break. Out here I didn't, so I kept making everything simpler until I trusted it.
Race production, bibs, and branding by the Saddles 100 crew. The wall, the console, the cards, and the film, designed and built by me.