PeCan Redesigning St. Jude Cloud's Pediatric Cancer Knowledge Base
Overview
PeCan holds data from over 9,000 pediatric cancer patient samples. Researchers use it to look for patterns — mutations, expression differences, histology — across diagnoses and subtypes. But the interface had grown limiting. Dense tables, disconnected views, and a visual language that had drifted from the rest of St. Jude Cloud made it harder to use than the data deserved.
I led the redesign: new visual identity, updated UX flows, a rebuilt design system, and front-end code across the platform. The goal was to make PeCan feel as rigorous as its data — clear, navigable, and consistent — without sacrificing the depth researchers depended on.
The work also included copywriting, launch strategy, newsletters, and documentation. Everything needed to ship together for the redesign to land as a cohesive release rather than a patchwork of updates.
The result: a clearer, faster, and more accessible platform for exploring genetic insights into childhood cancer.
Completely redesigned core features for launch
Unique patient samples available to explore
Unified design system for cohesion across product, prototyping, and development
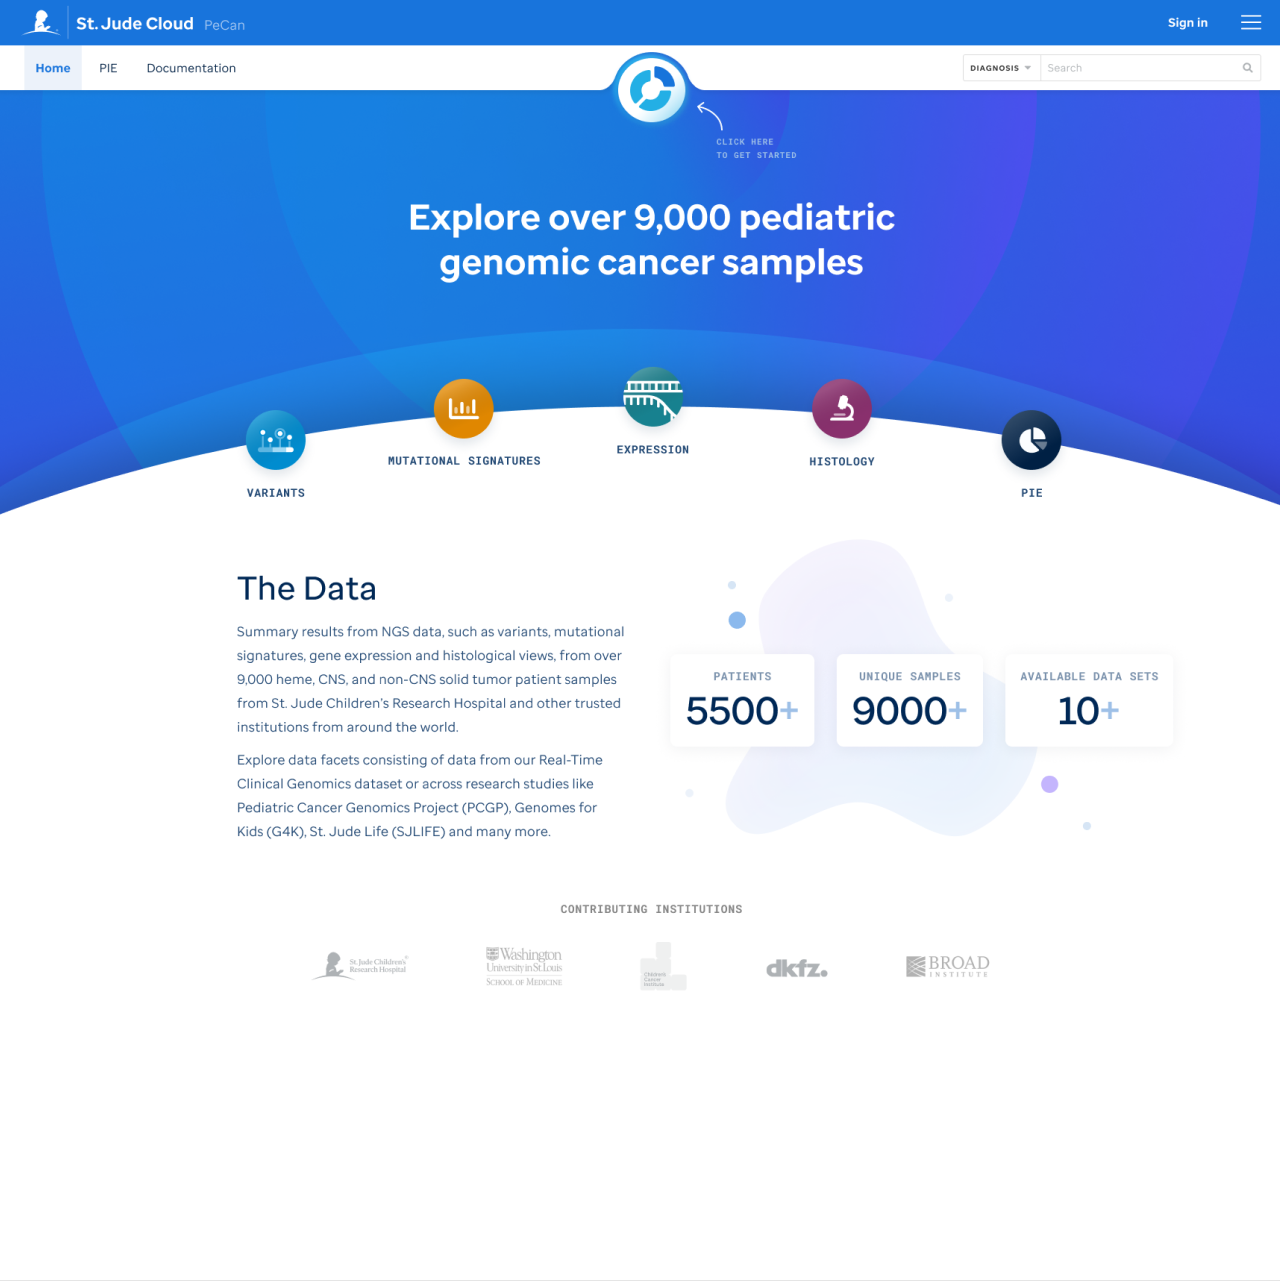 PeCan homepage hero design
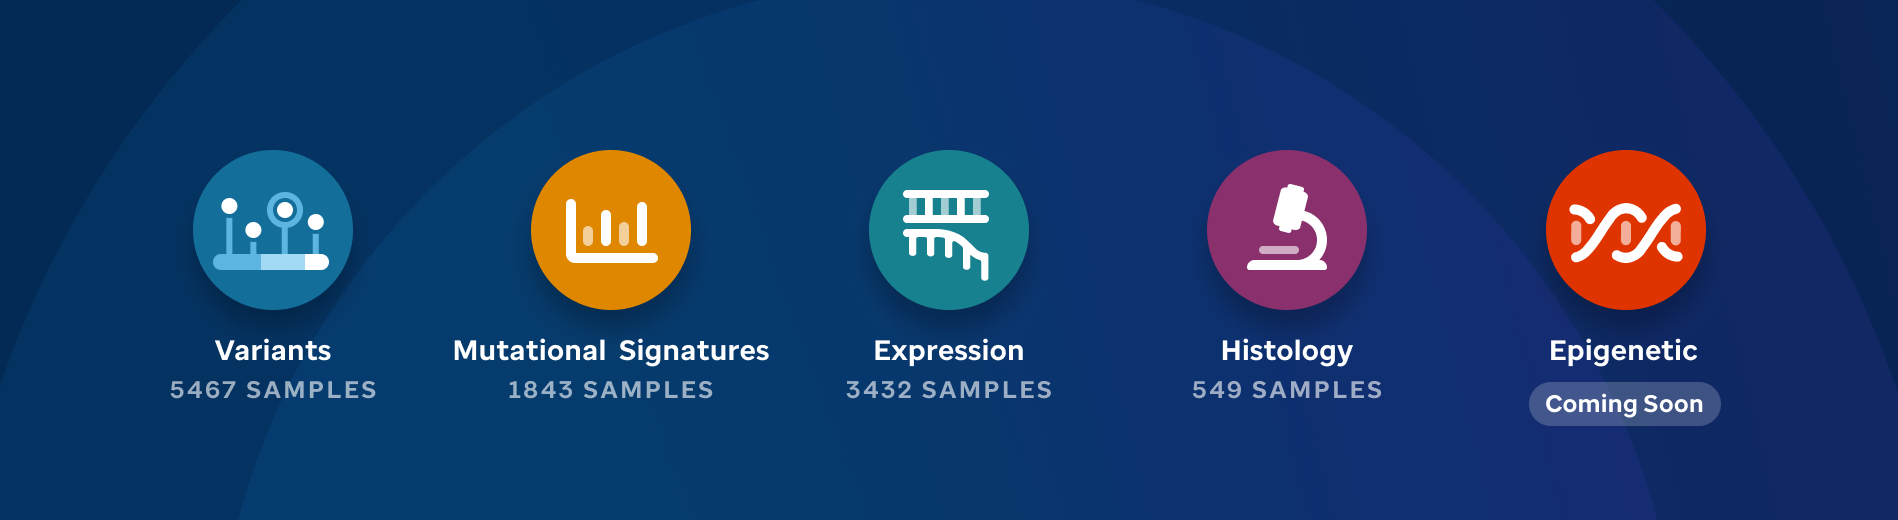
 Homepage data facet section designs
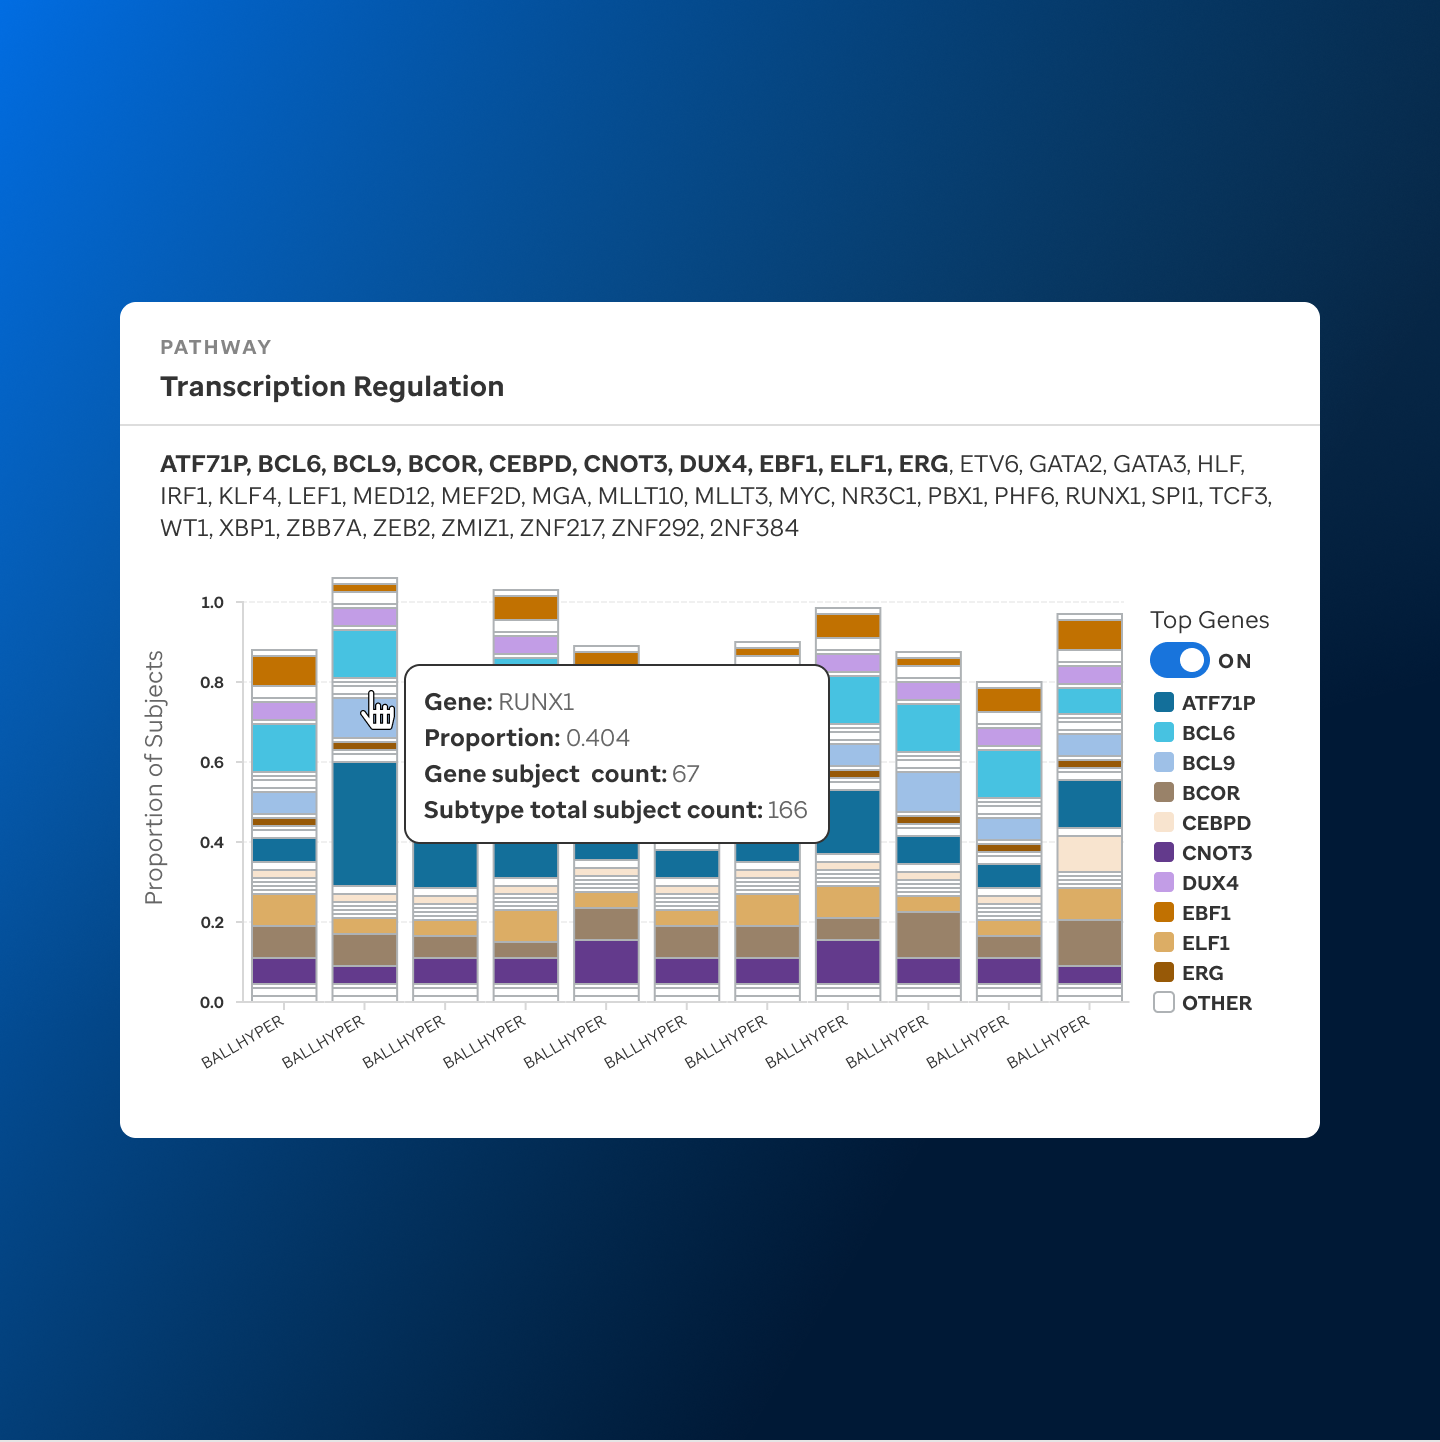
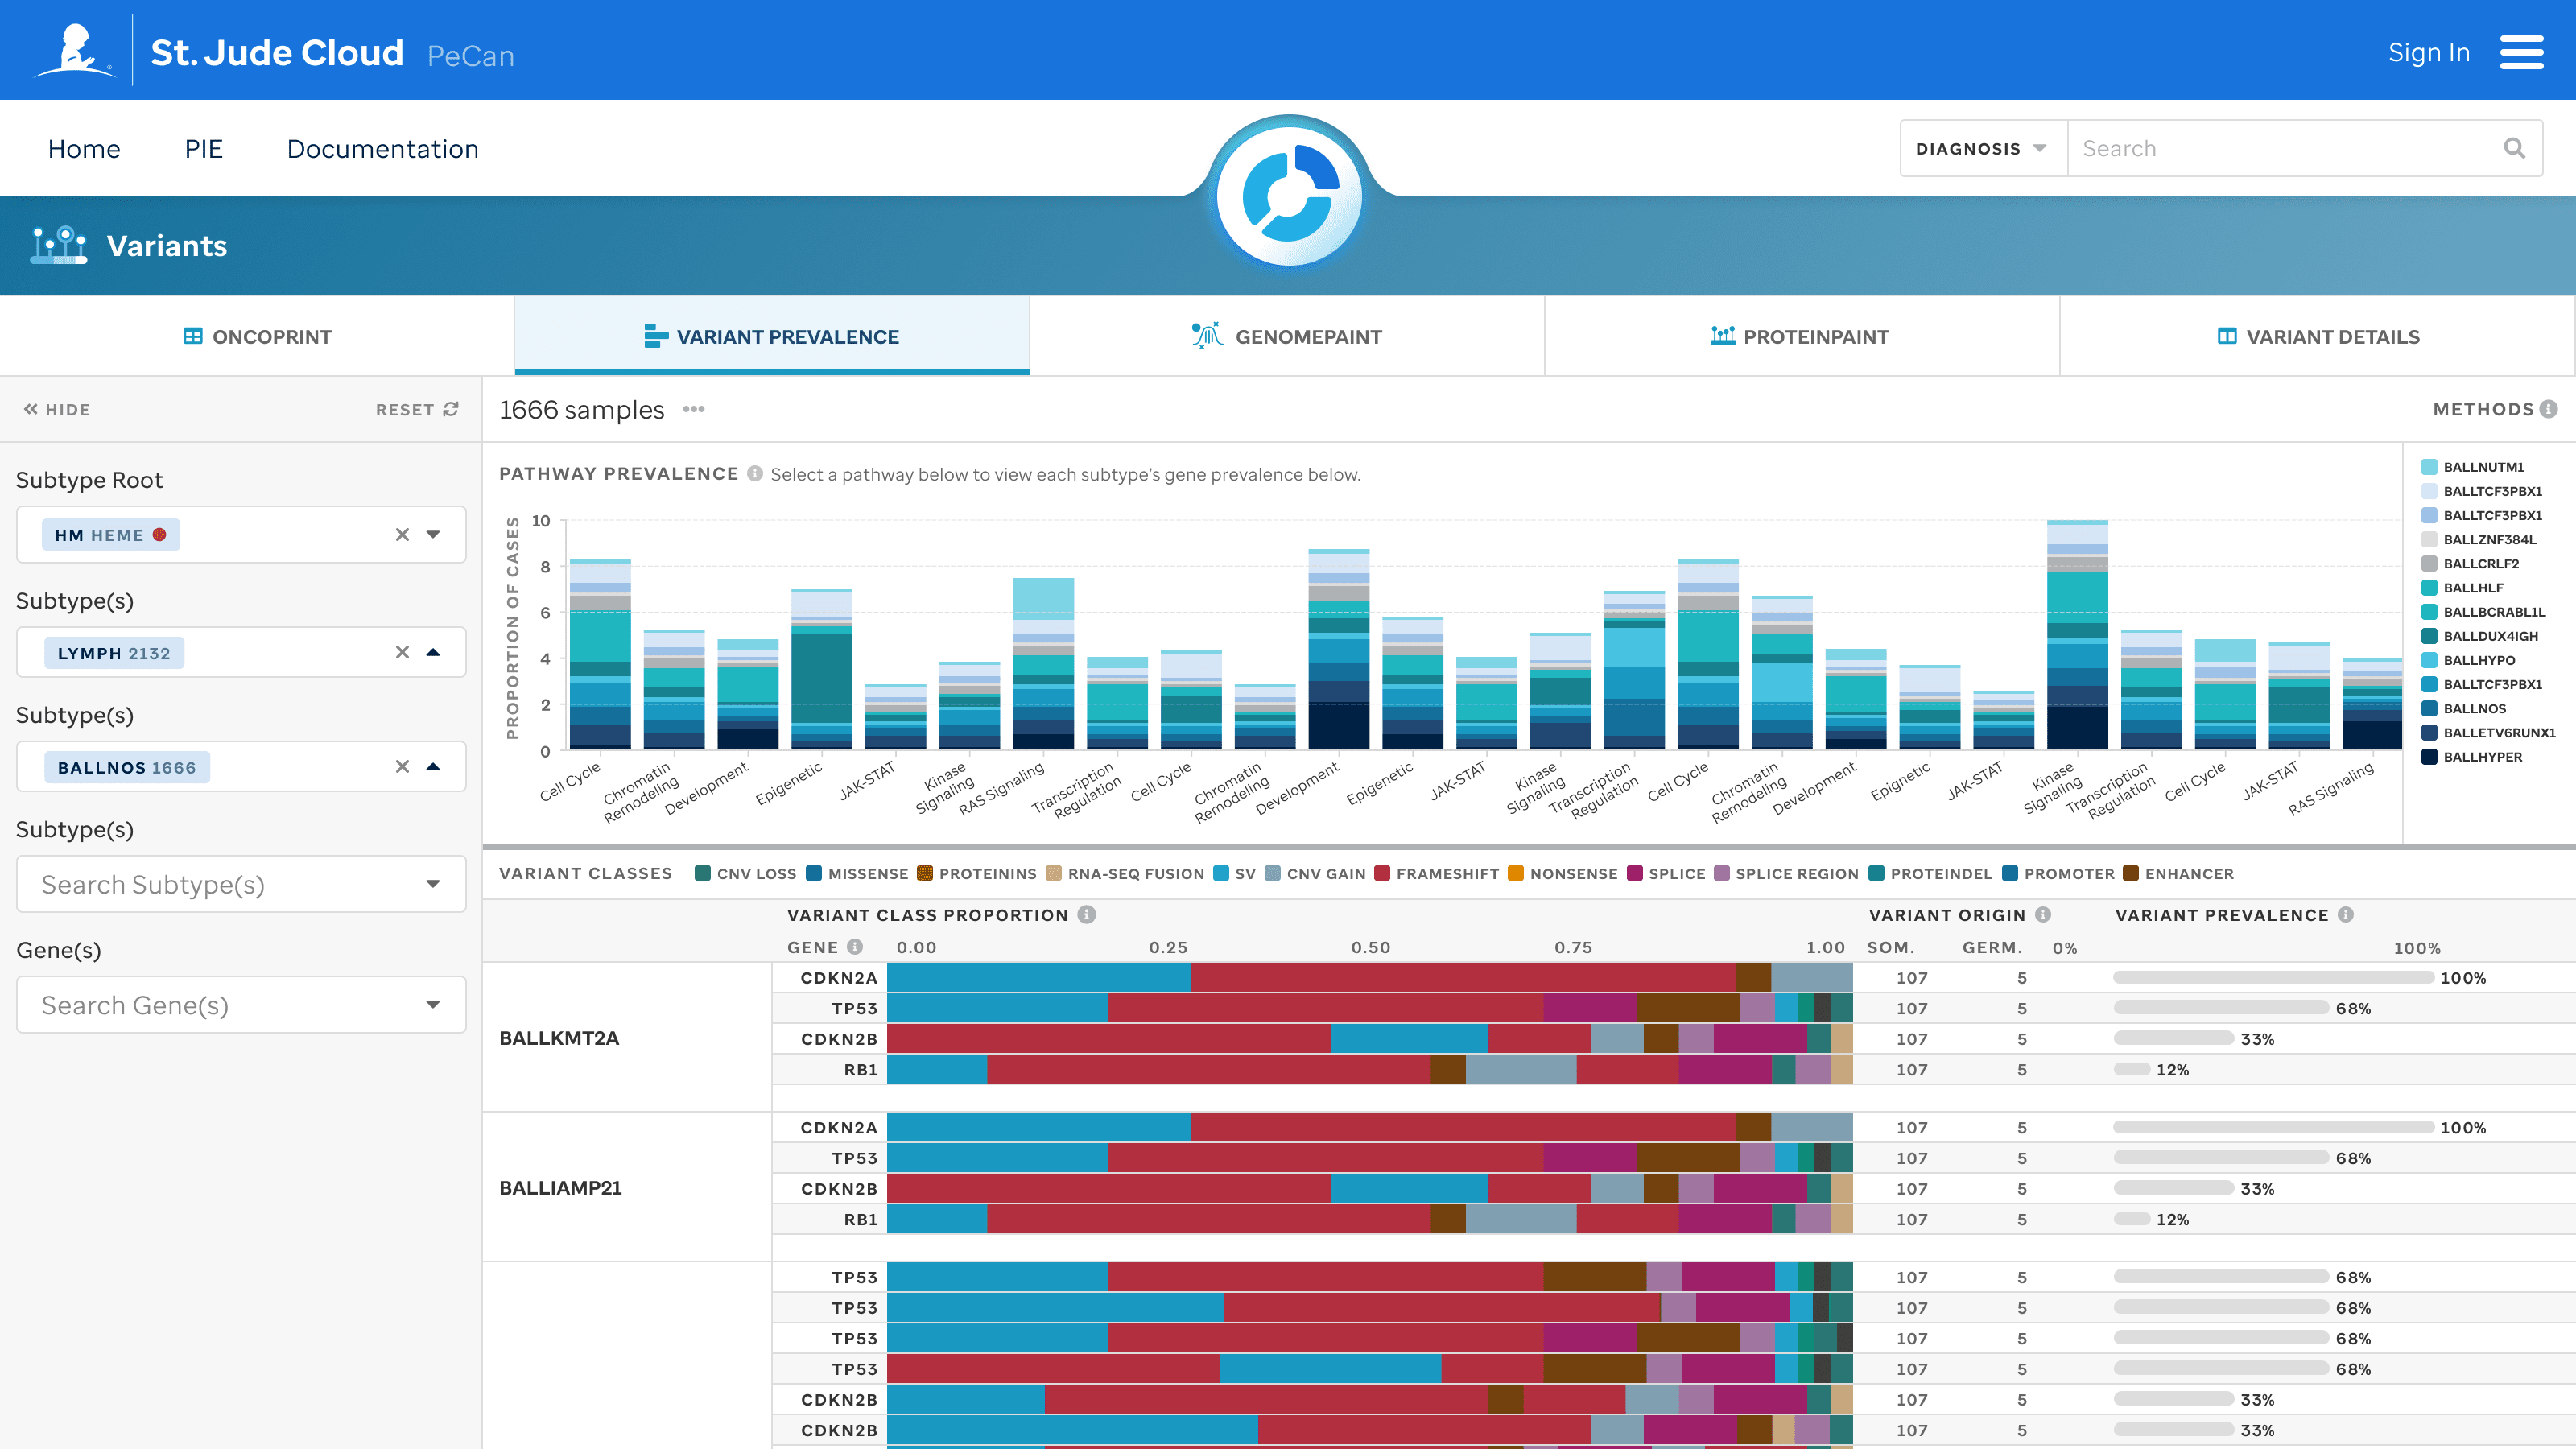 Variants data facet displaying variant pathway prevalence within the LYMPH subtype
Challenges
Unify PeCan's design and brand identity with the broader St. Jude Cloud ecosystem.
Transform dense, technical genomic data into clear, navigable experiences for researchers.
Balance scientific precision with human-centered design and the variabilities of a web-based platform.
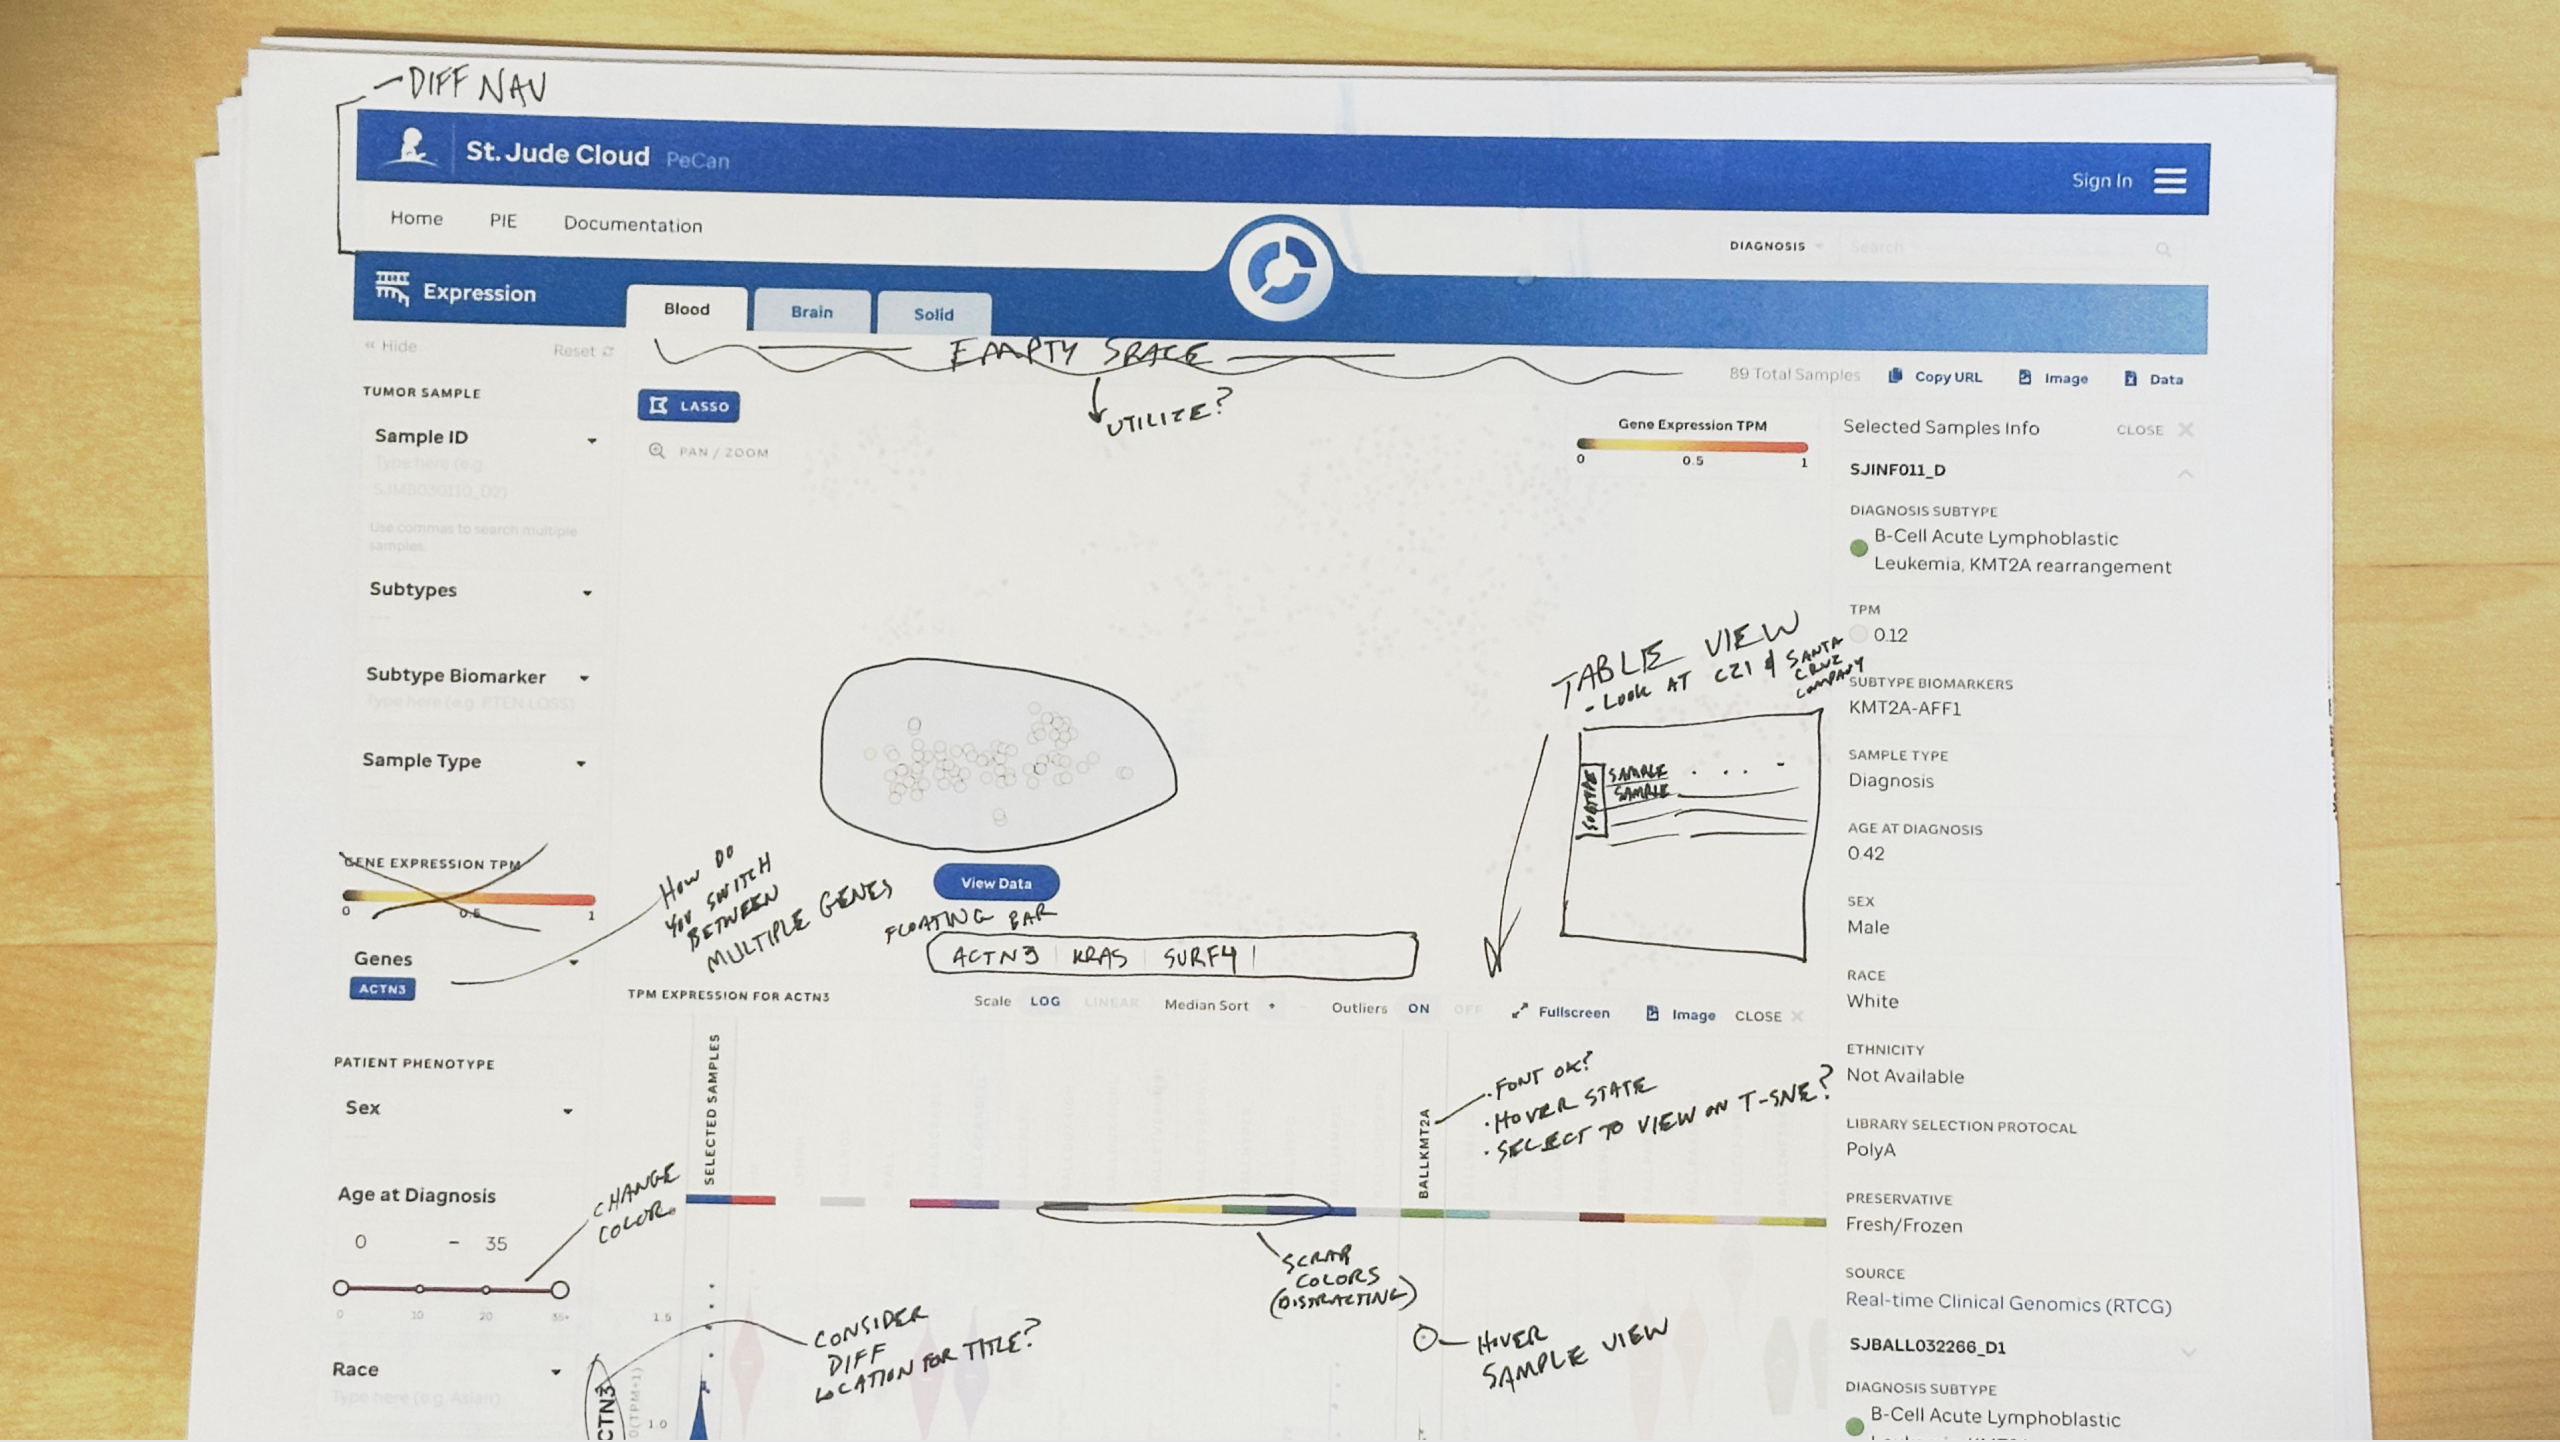 Proposed changes from design review of the Expression data facet
Contributions
Visual Identity & Branding
I created a new visual identity and logo system for PeCan, aligned with St. Jude Cloud's brand guidelines and visual principles.
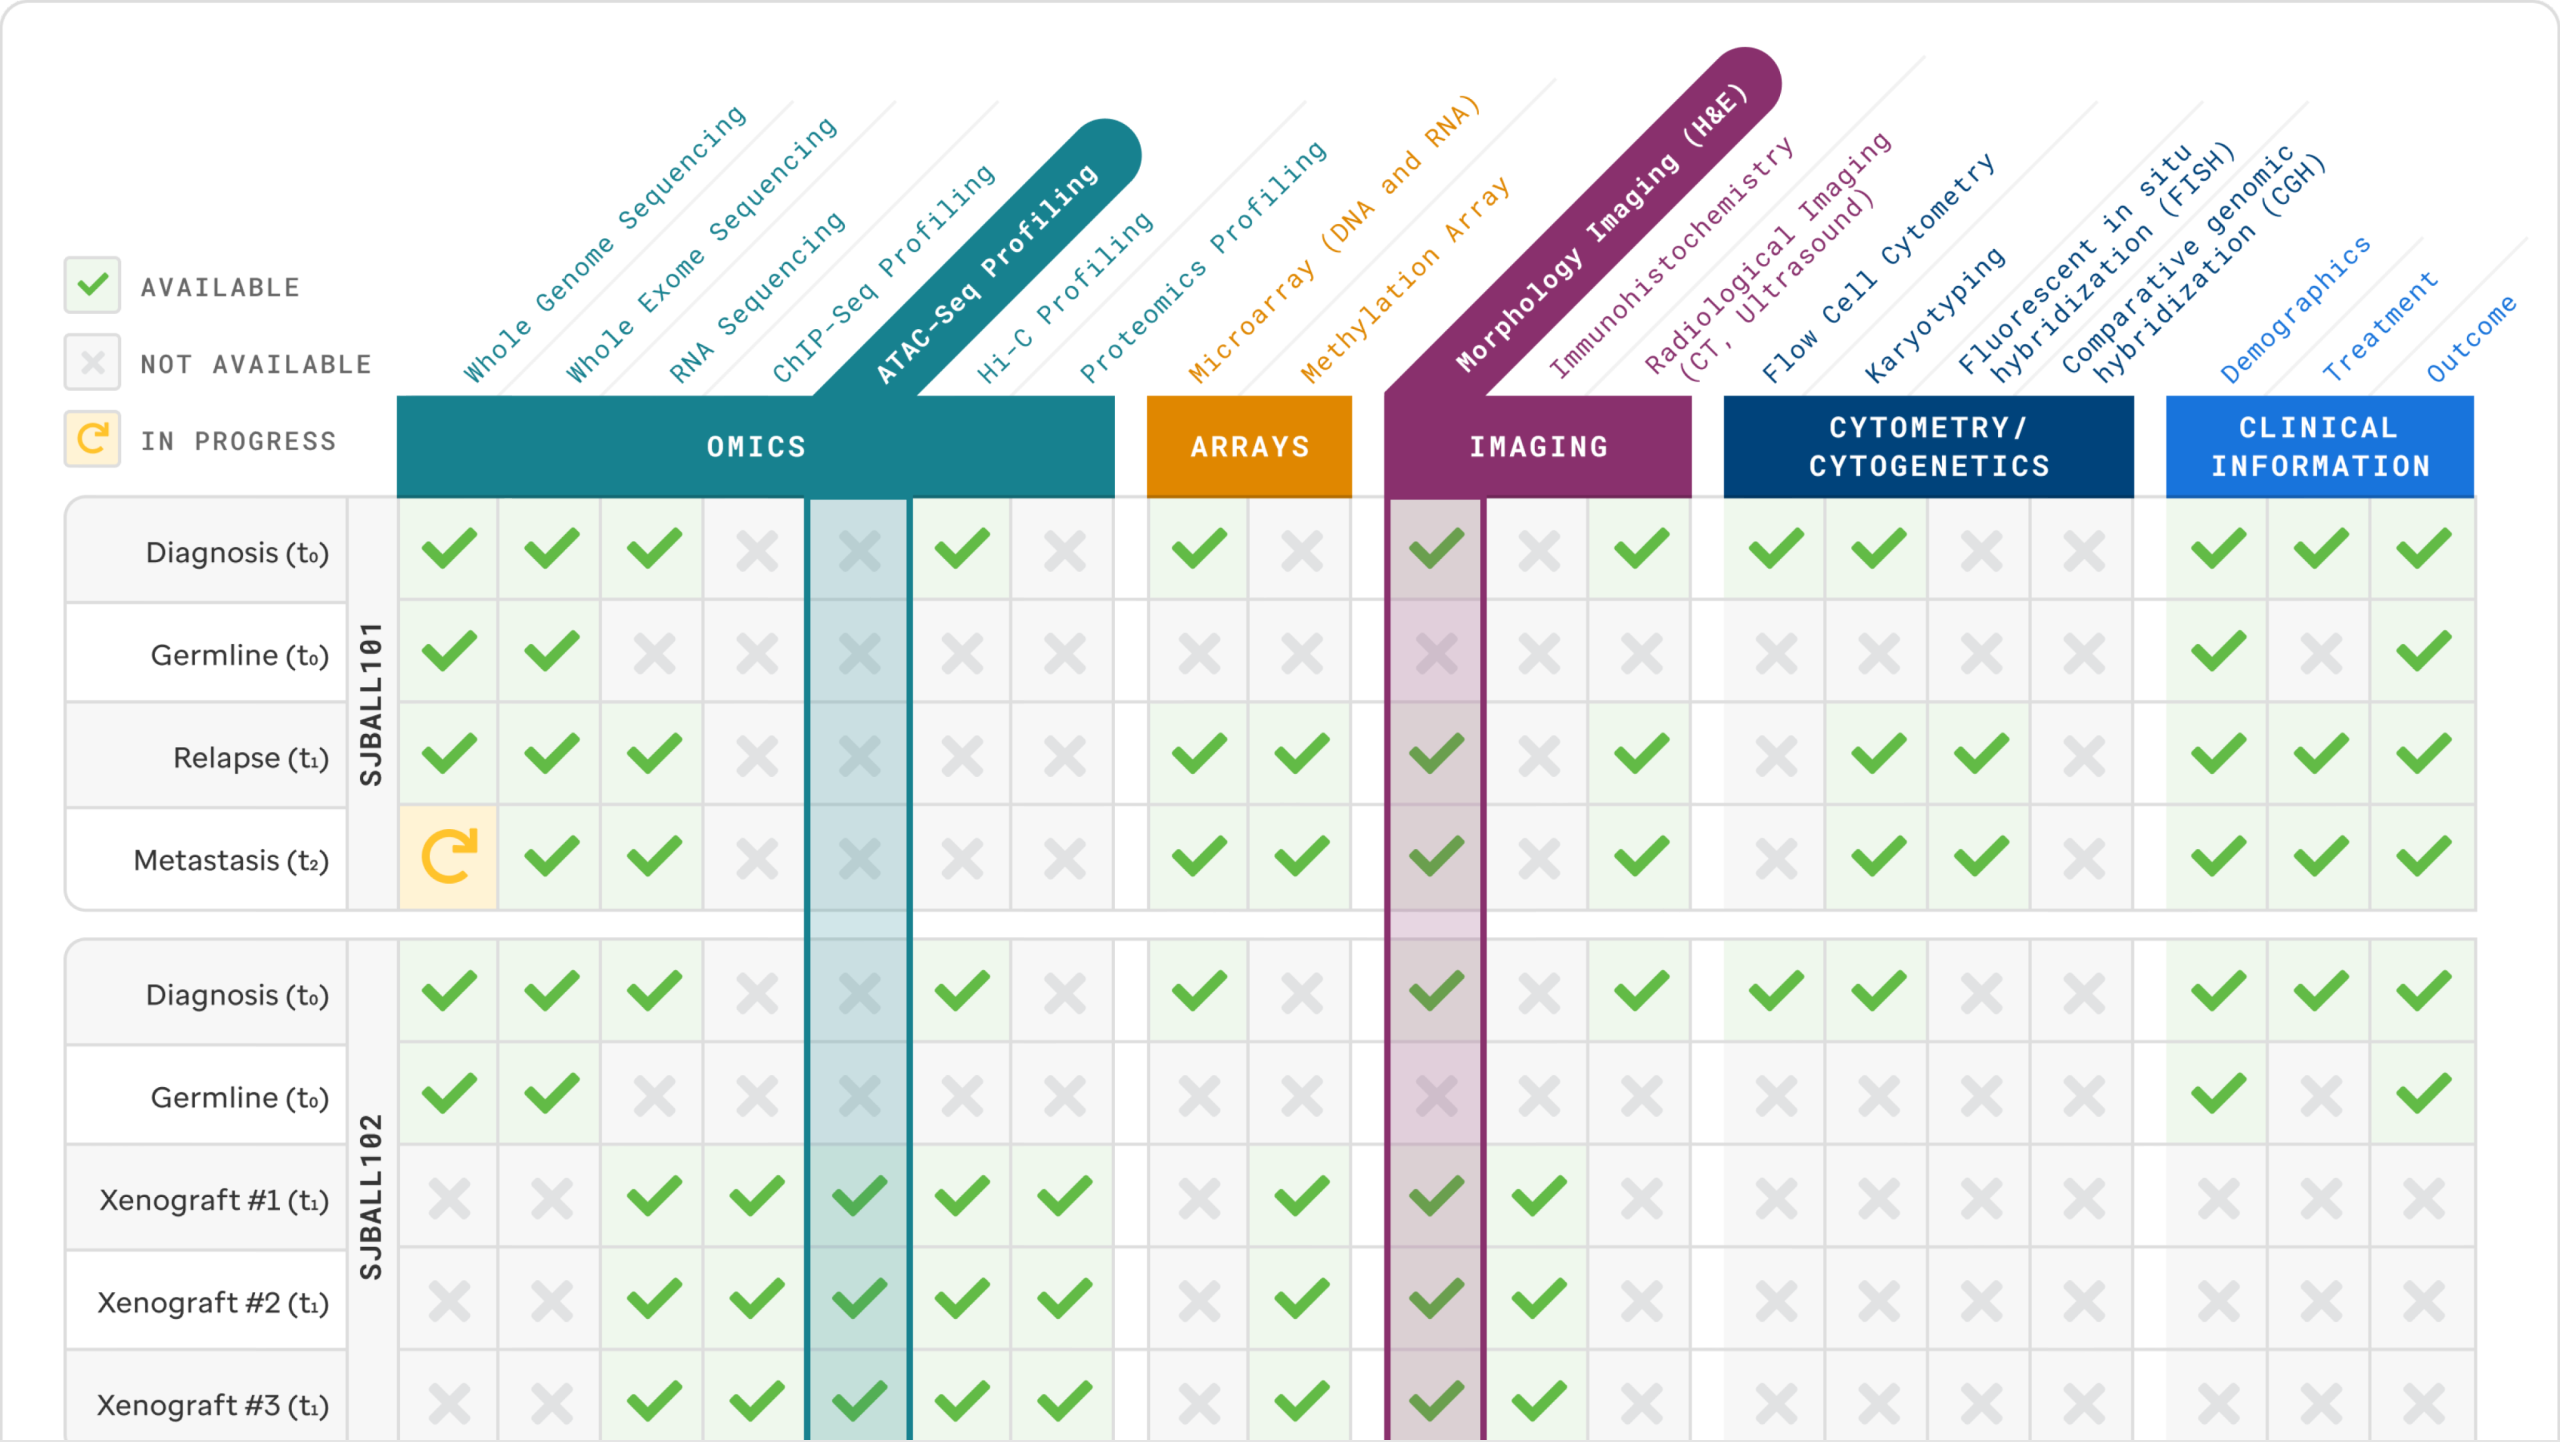
 Data table presenting the data available within the PeCan platform
UX & UI Redesign
Updated UX flows for data exploration and comparison, making it easier for researchers to navigate, analyze, and compare genomic datasets.
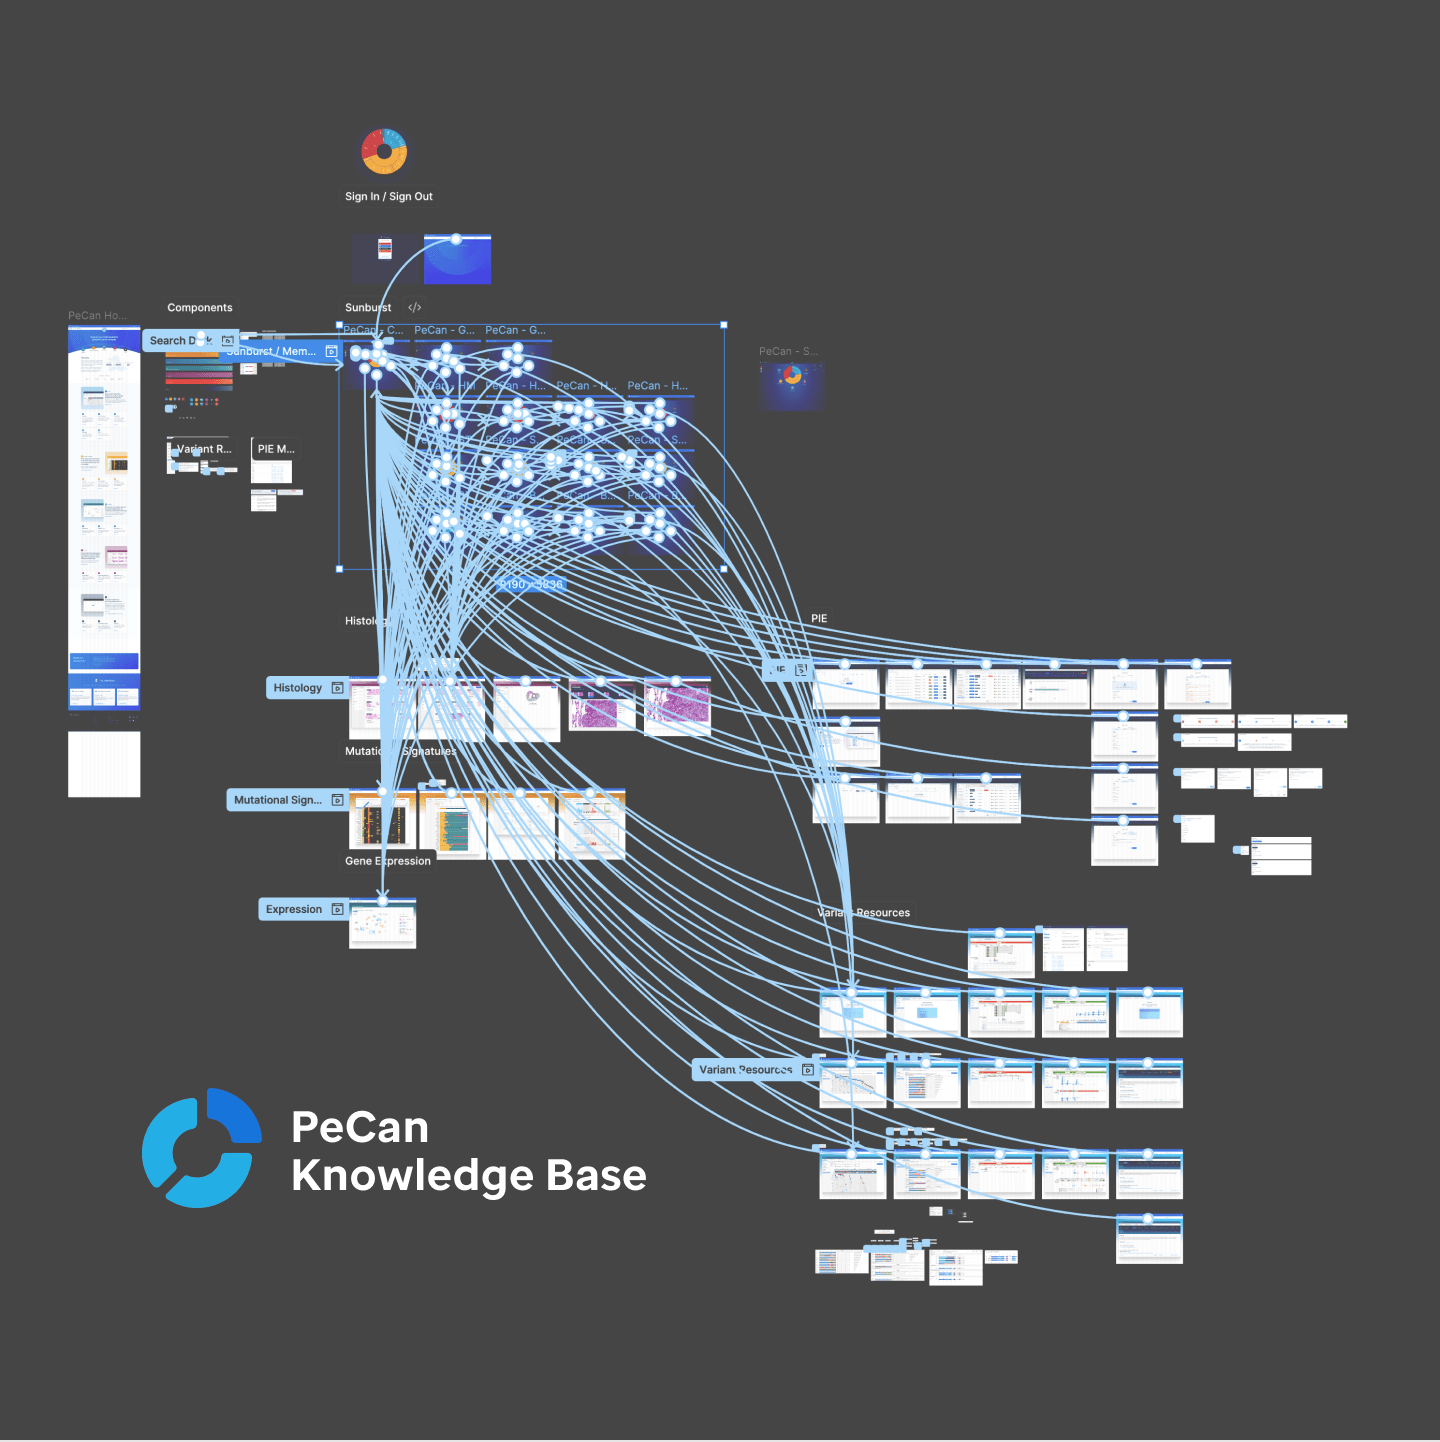 PeCan prototype connections
 Data modal user interface component
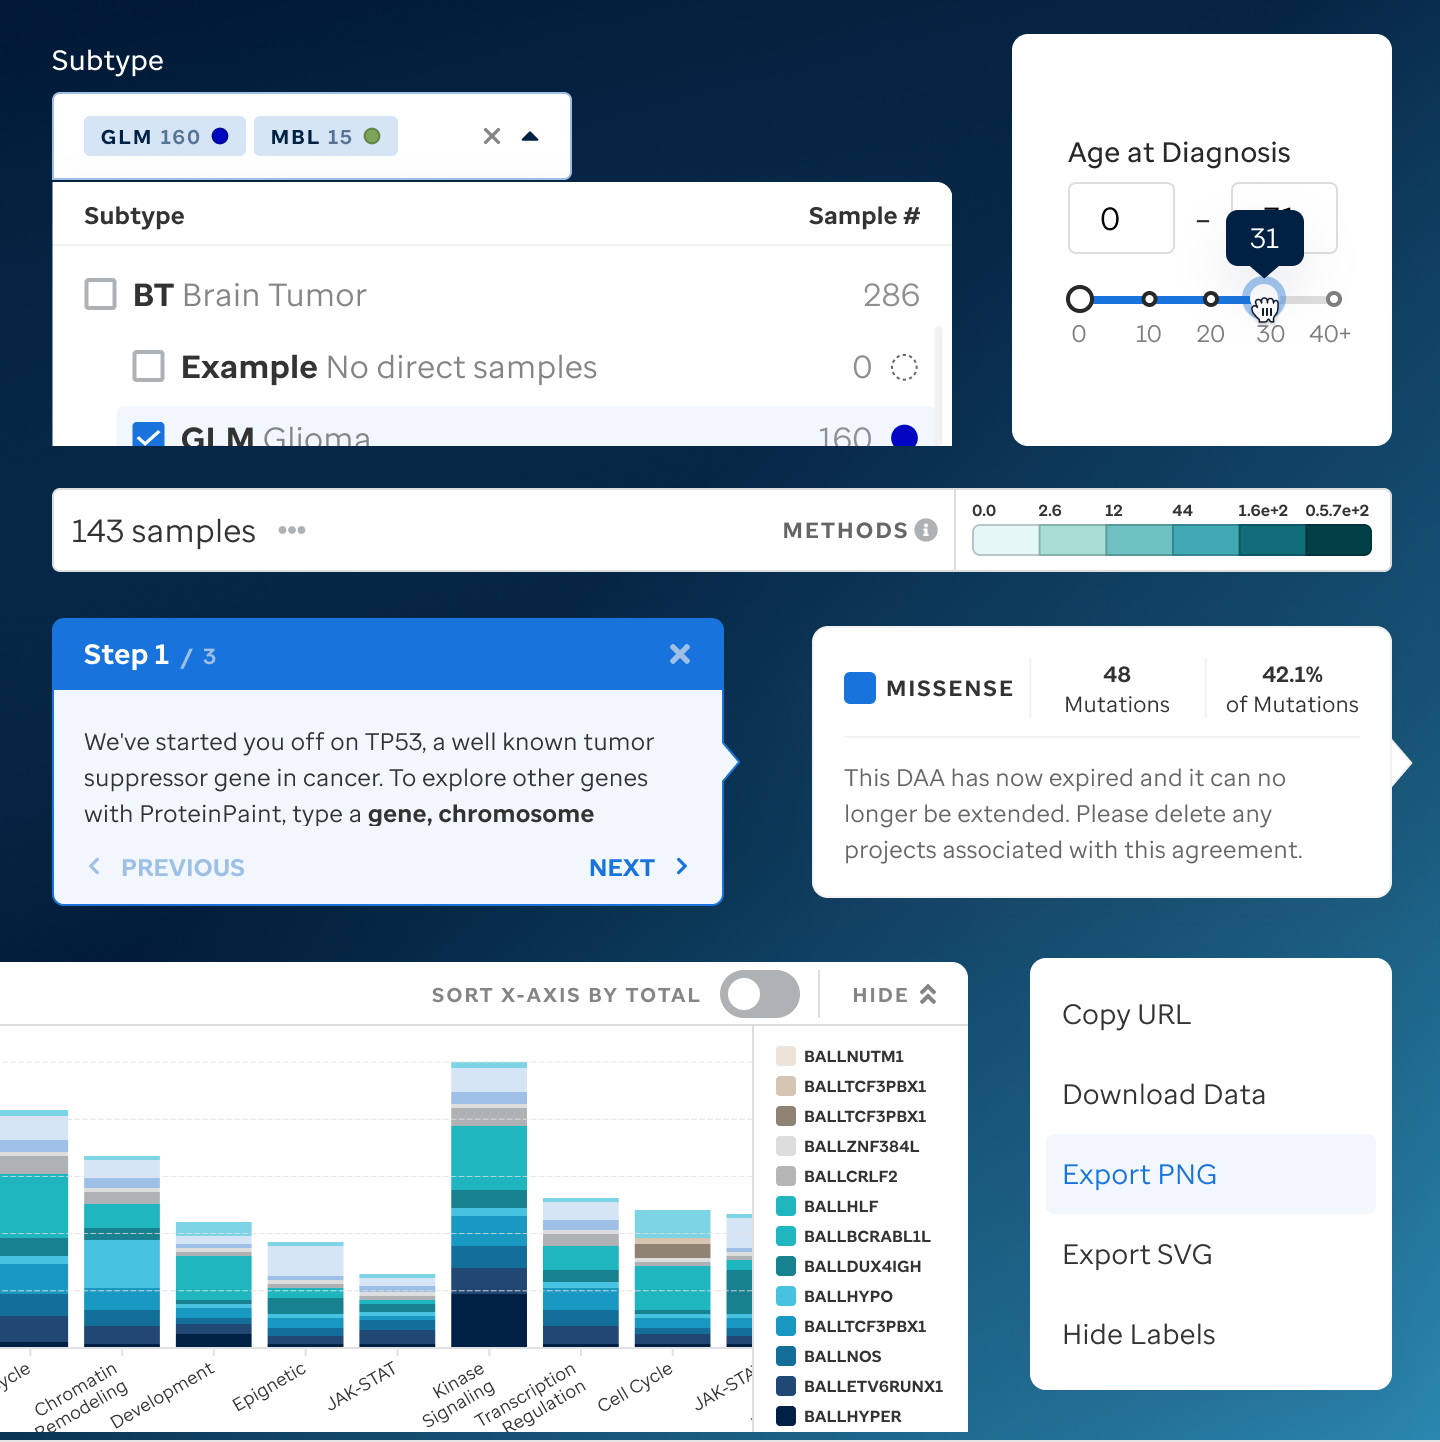 User interface components used within PeCan
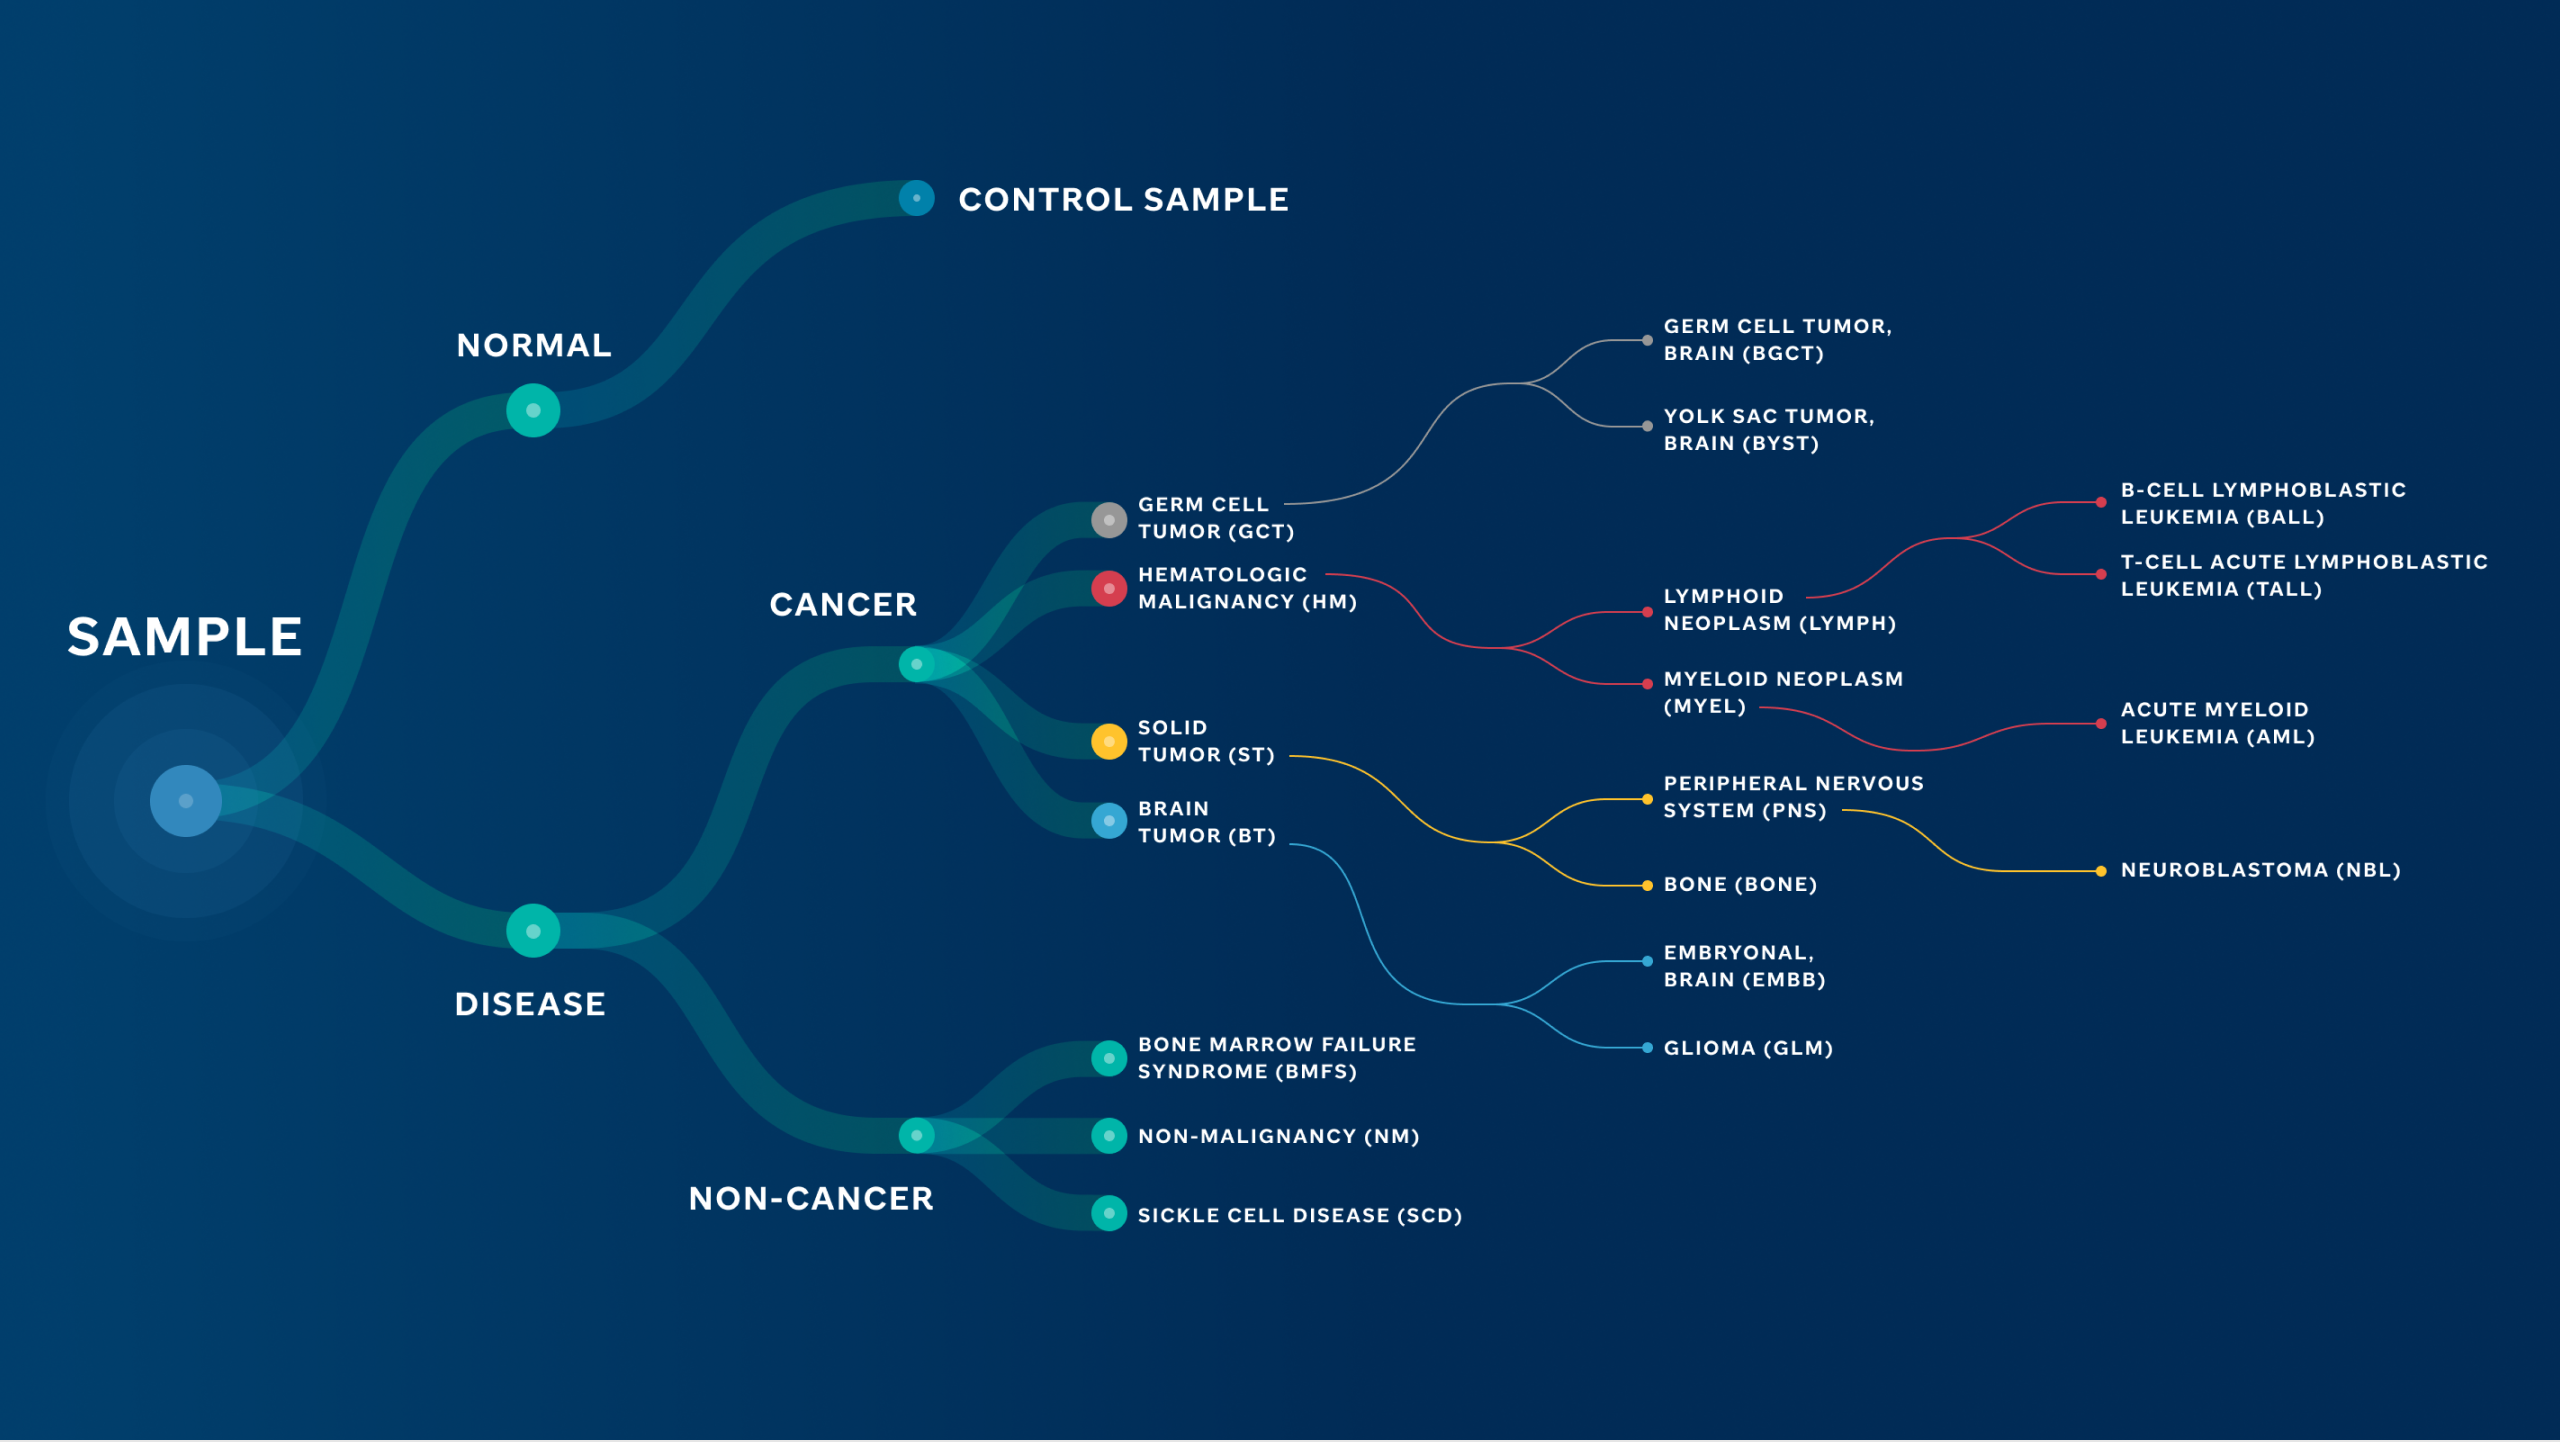
 Tree navigation concept for disease ontology browsing
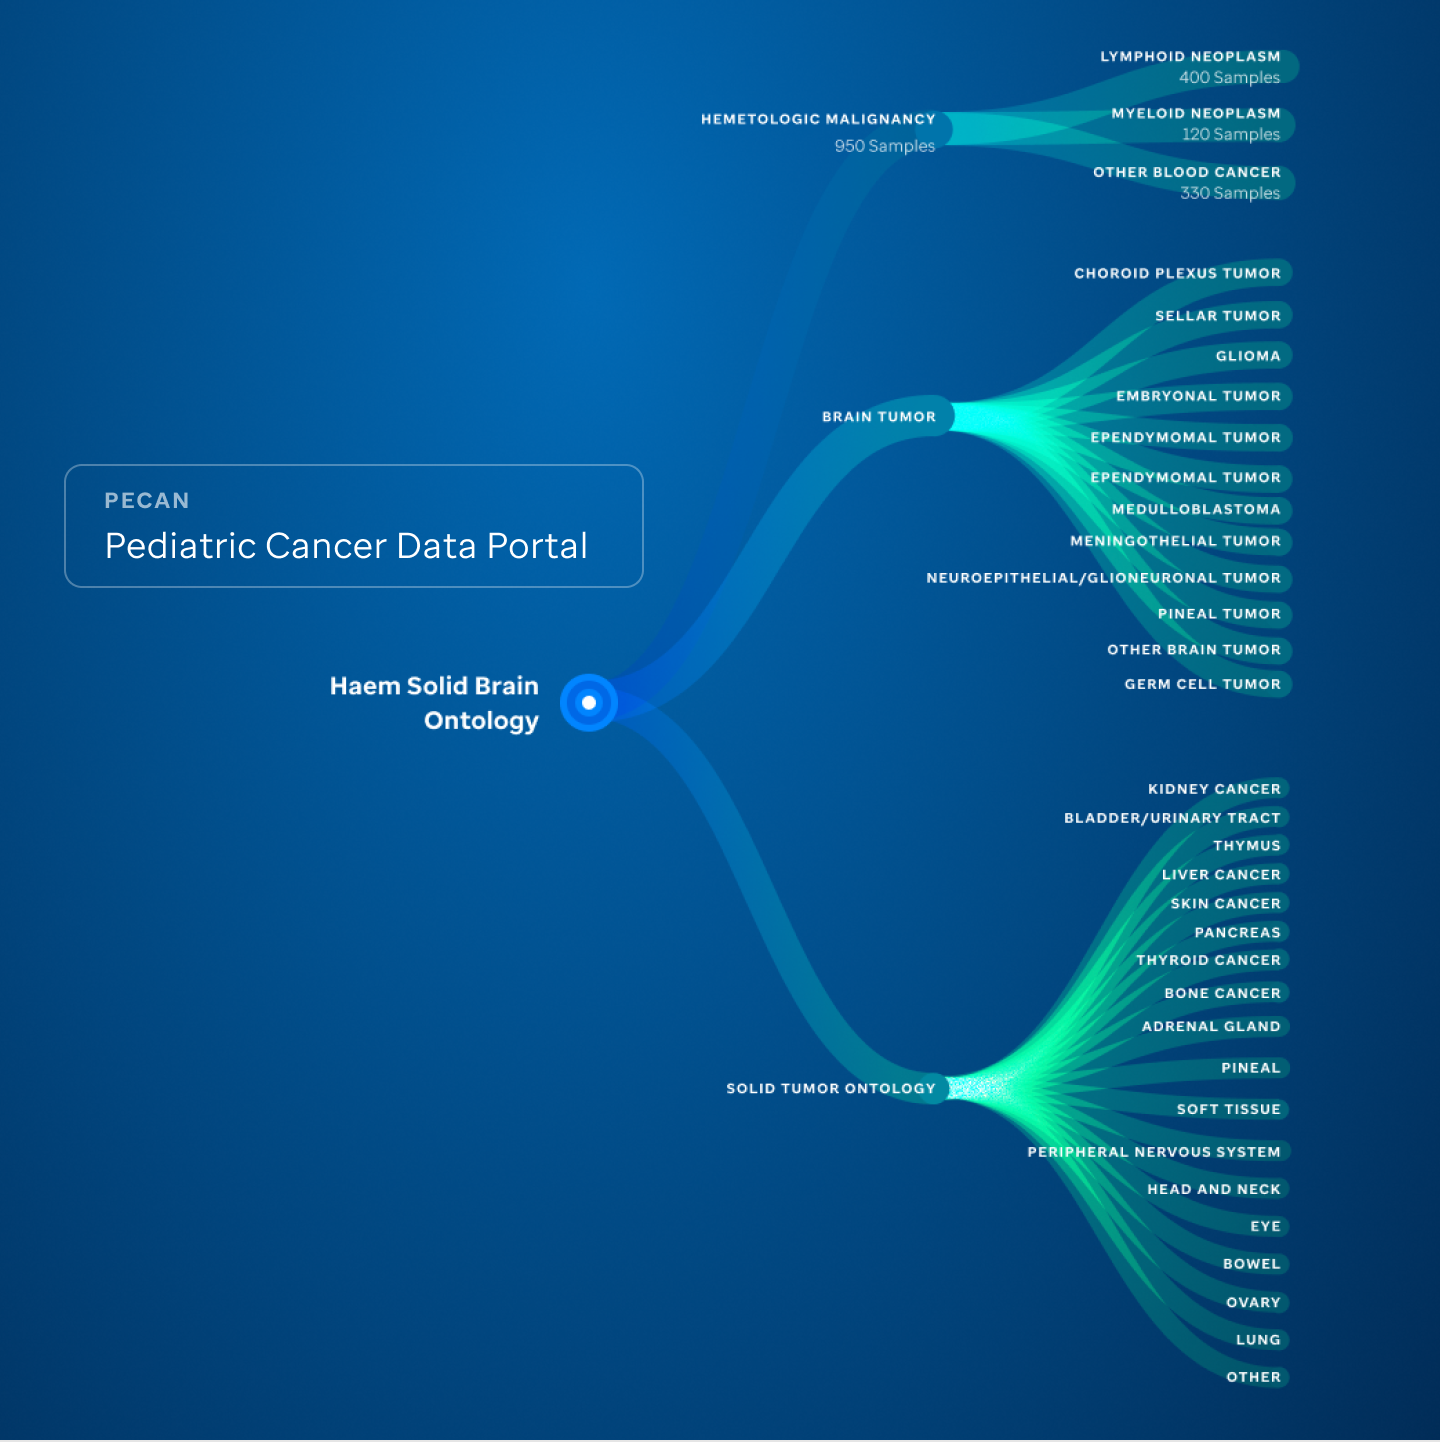
 Disease ontology illustration
Content Strategy & Copywriting
Simplified language for onboarding, dataset descriptions, and publication summaries to make complex information more accessible to users across disciplines.
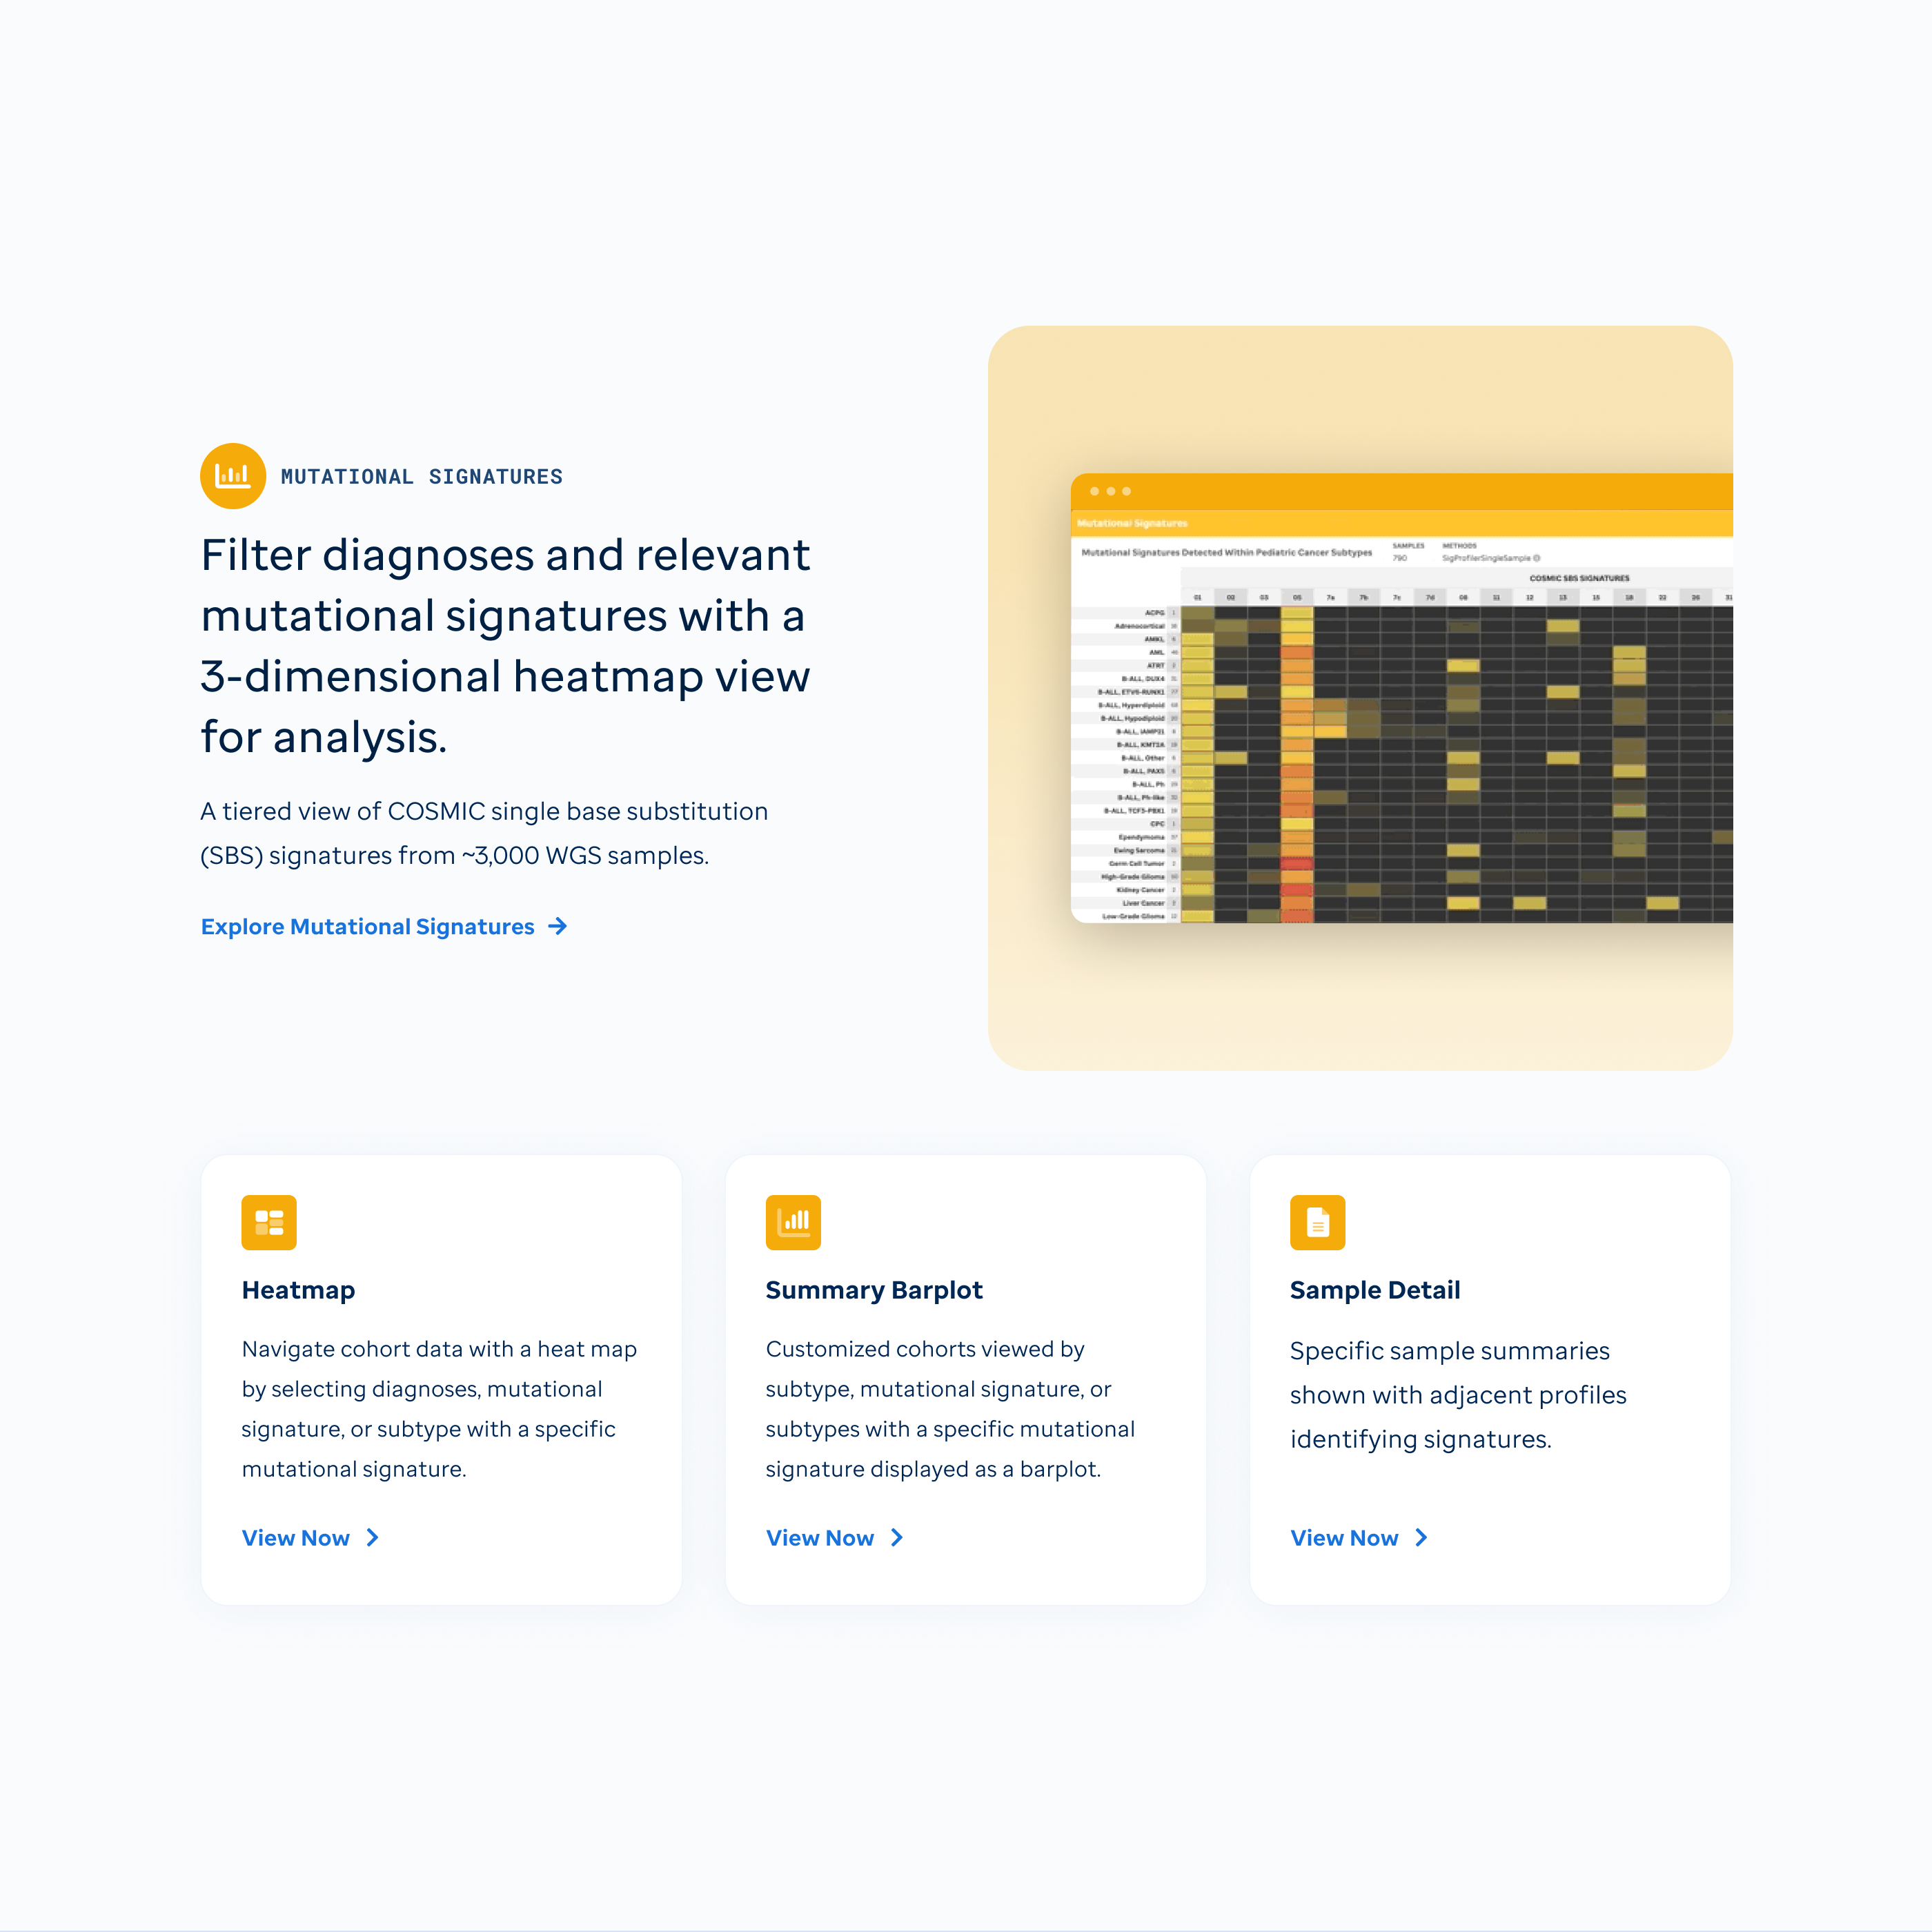 Mutational signatures homepage
Design System Integration
Integrated PeCan's redesign into St. Jude's broader design system to ensure visual and functional consistency across all cloud tools.
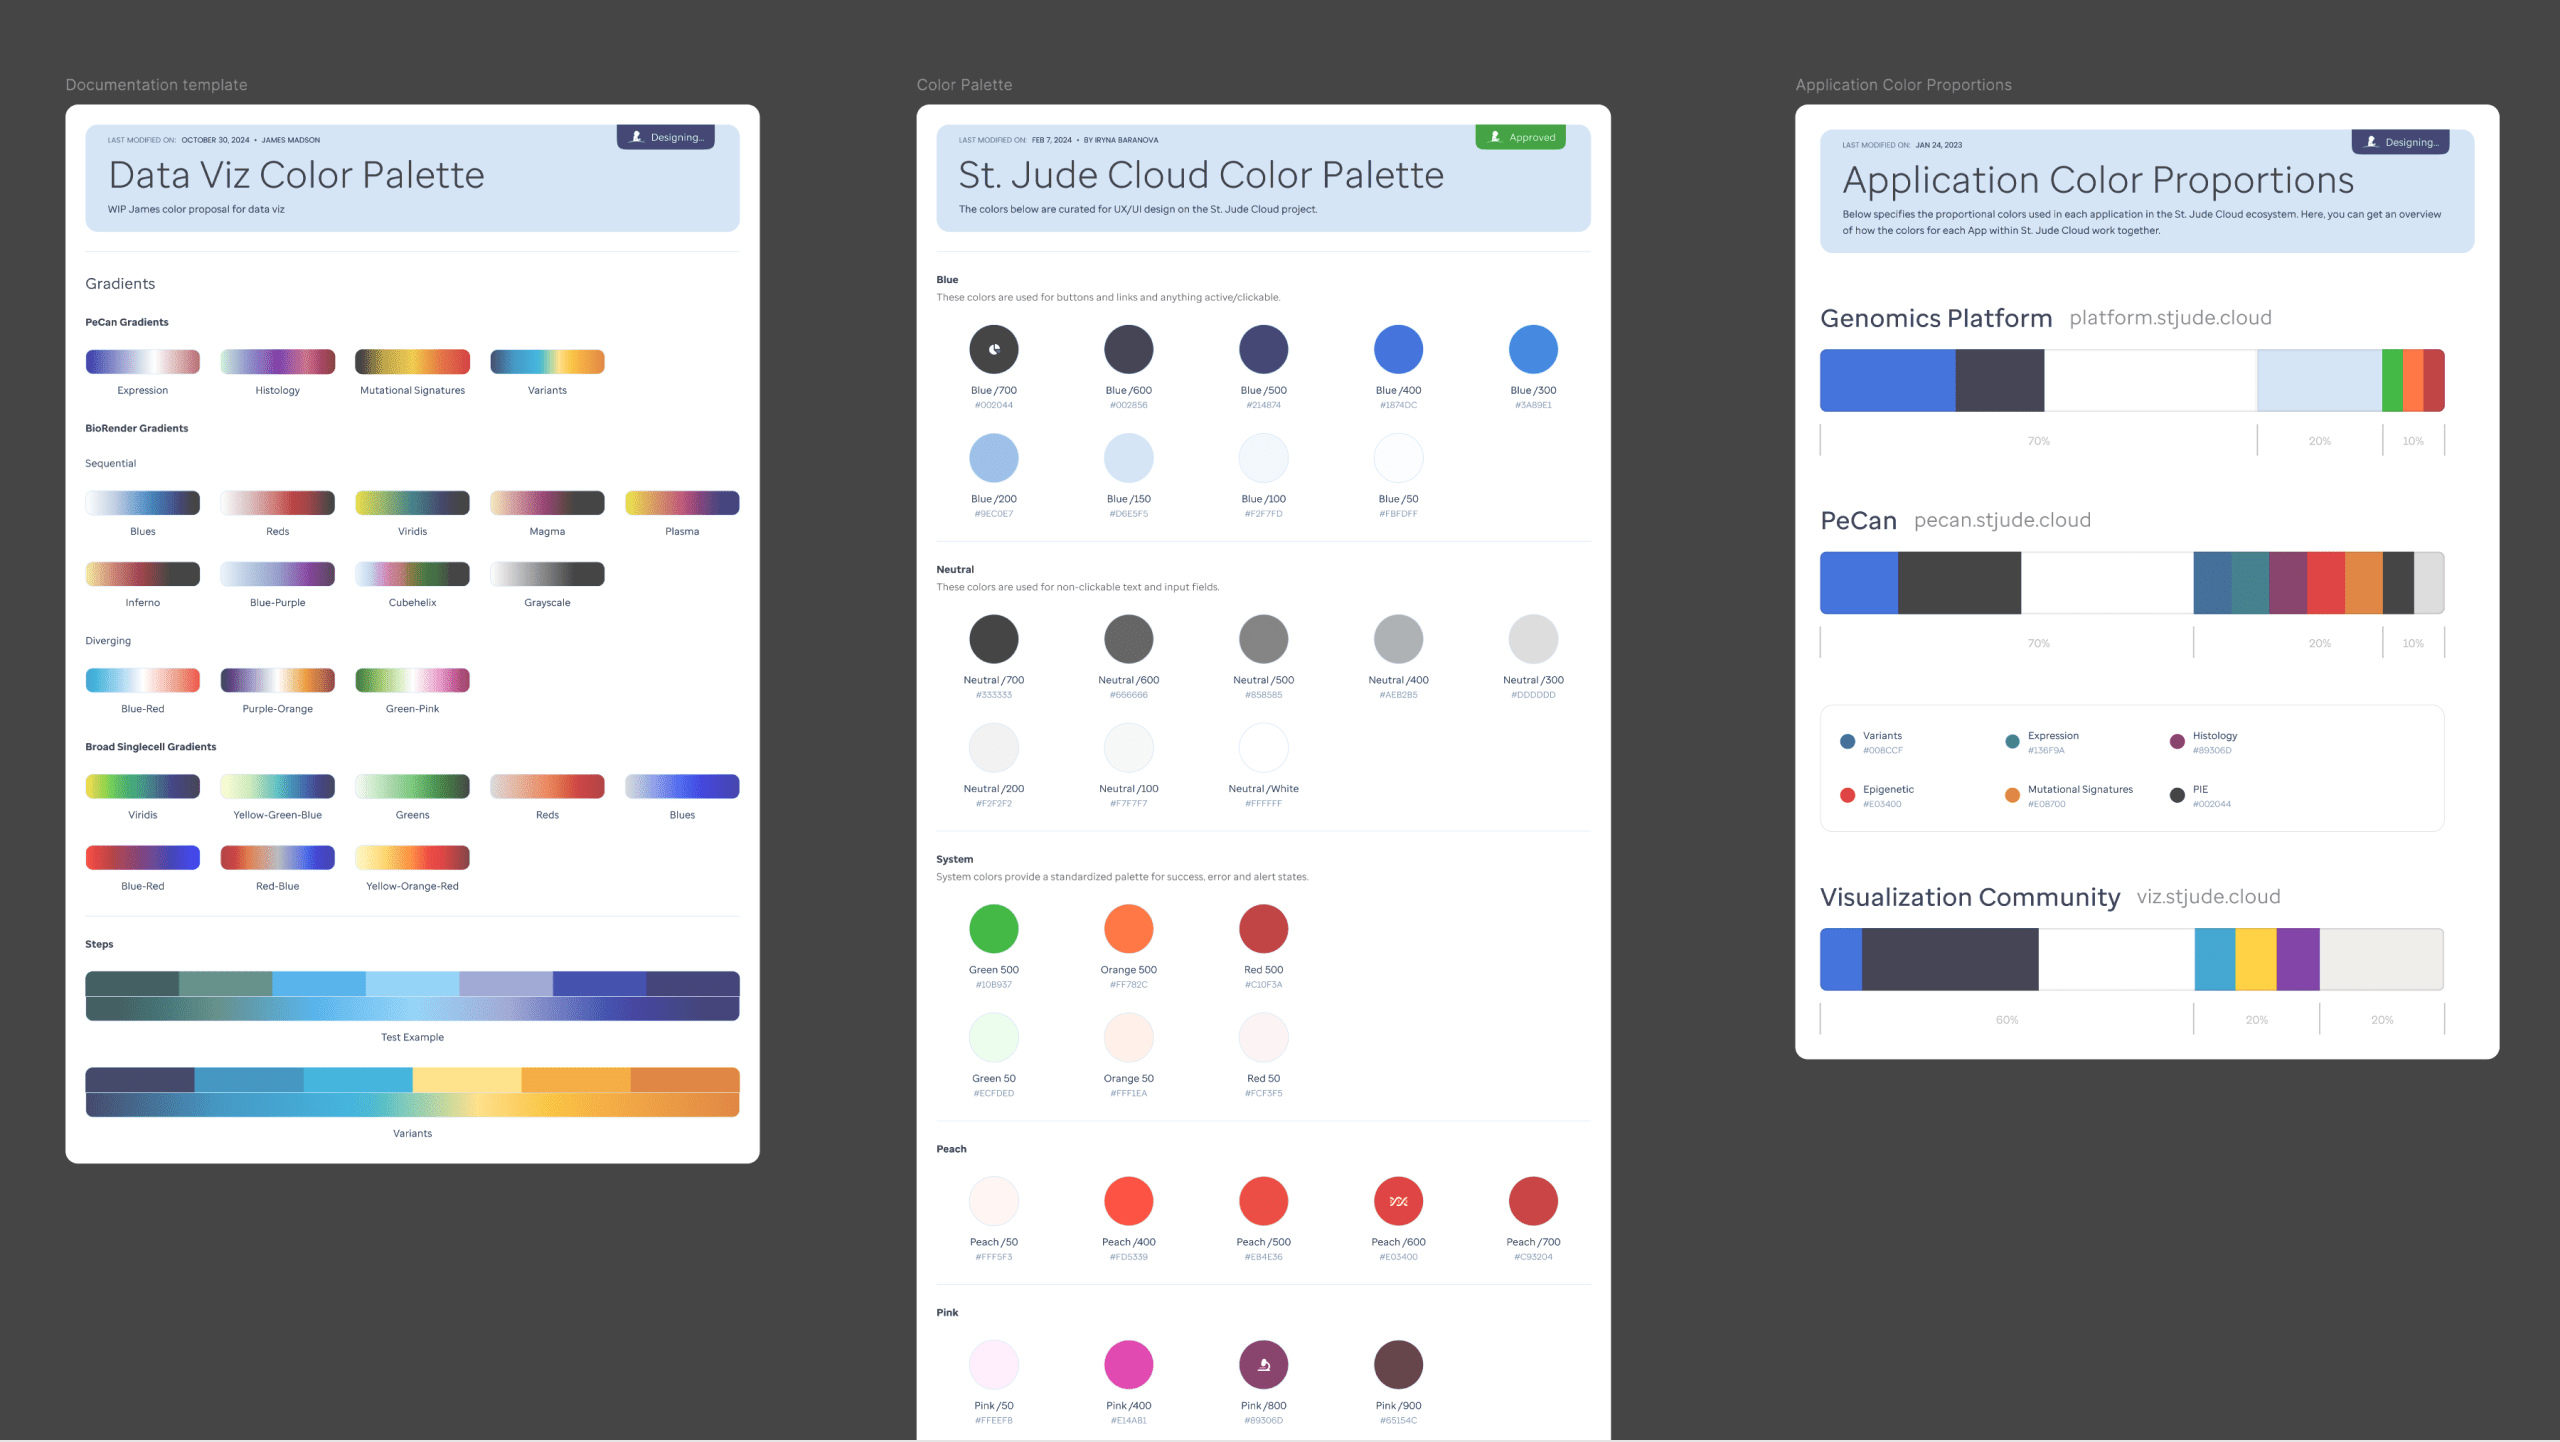 Design system colors
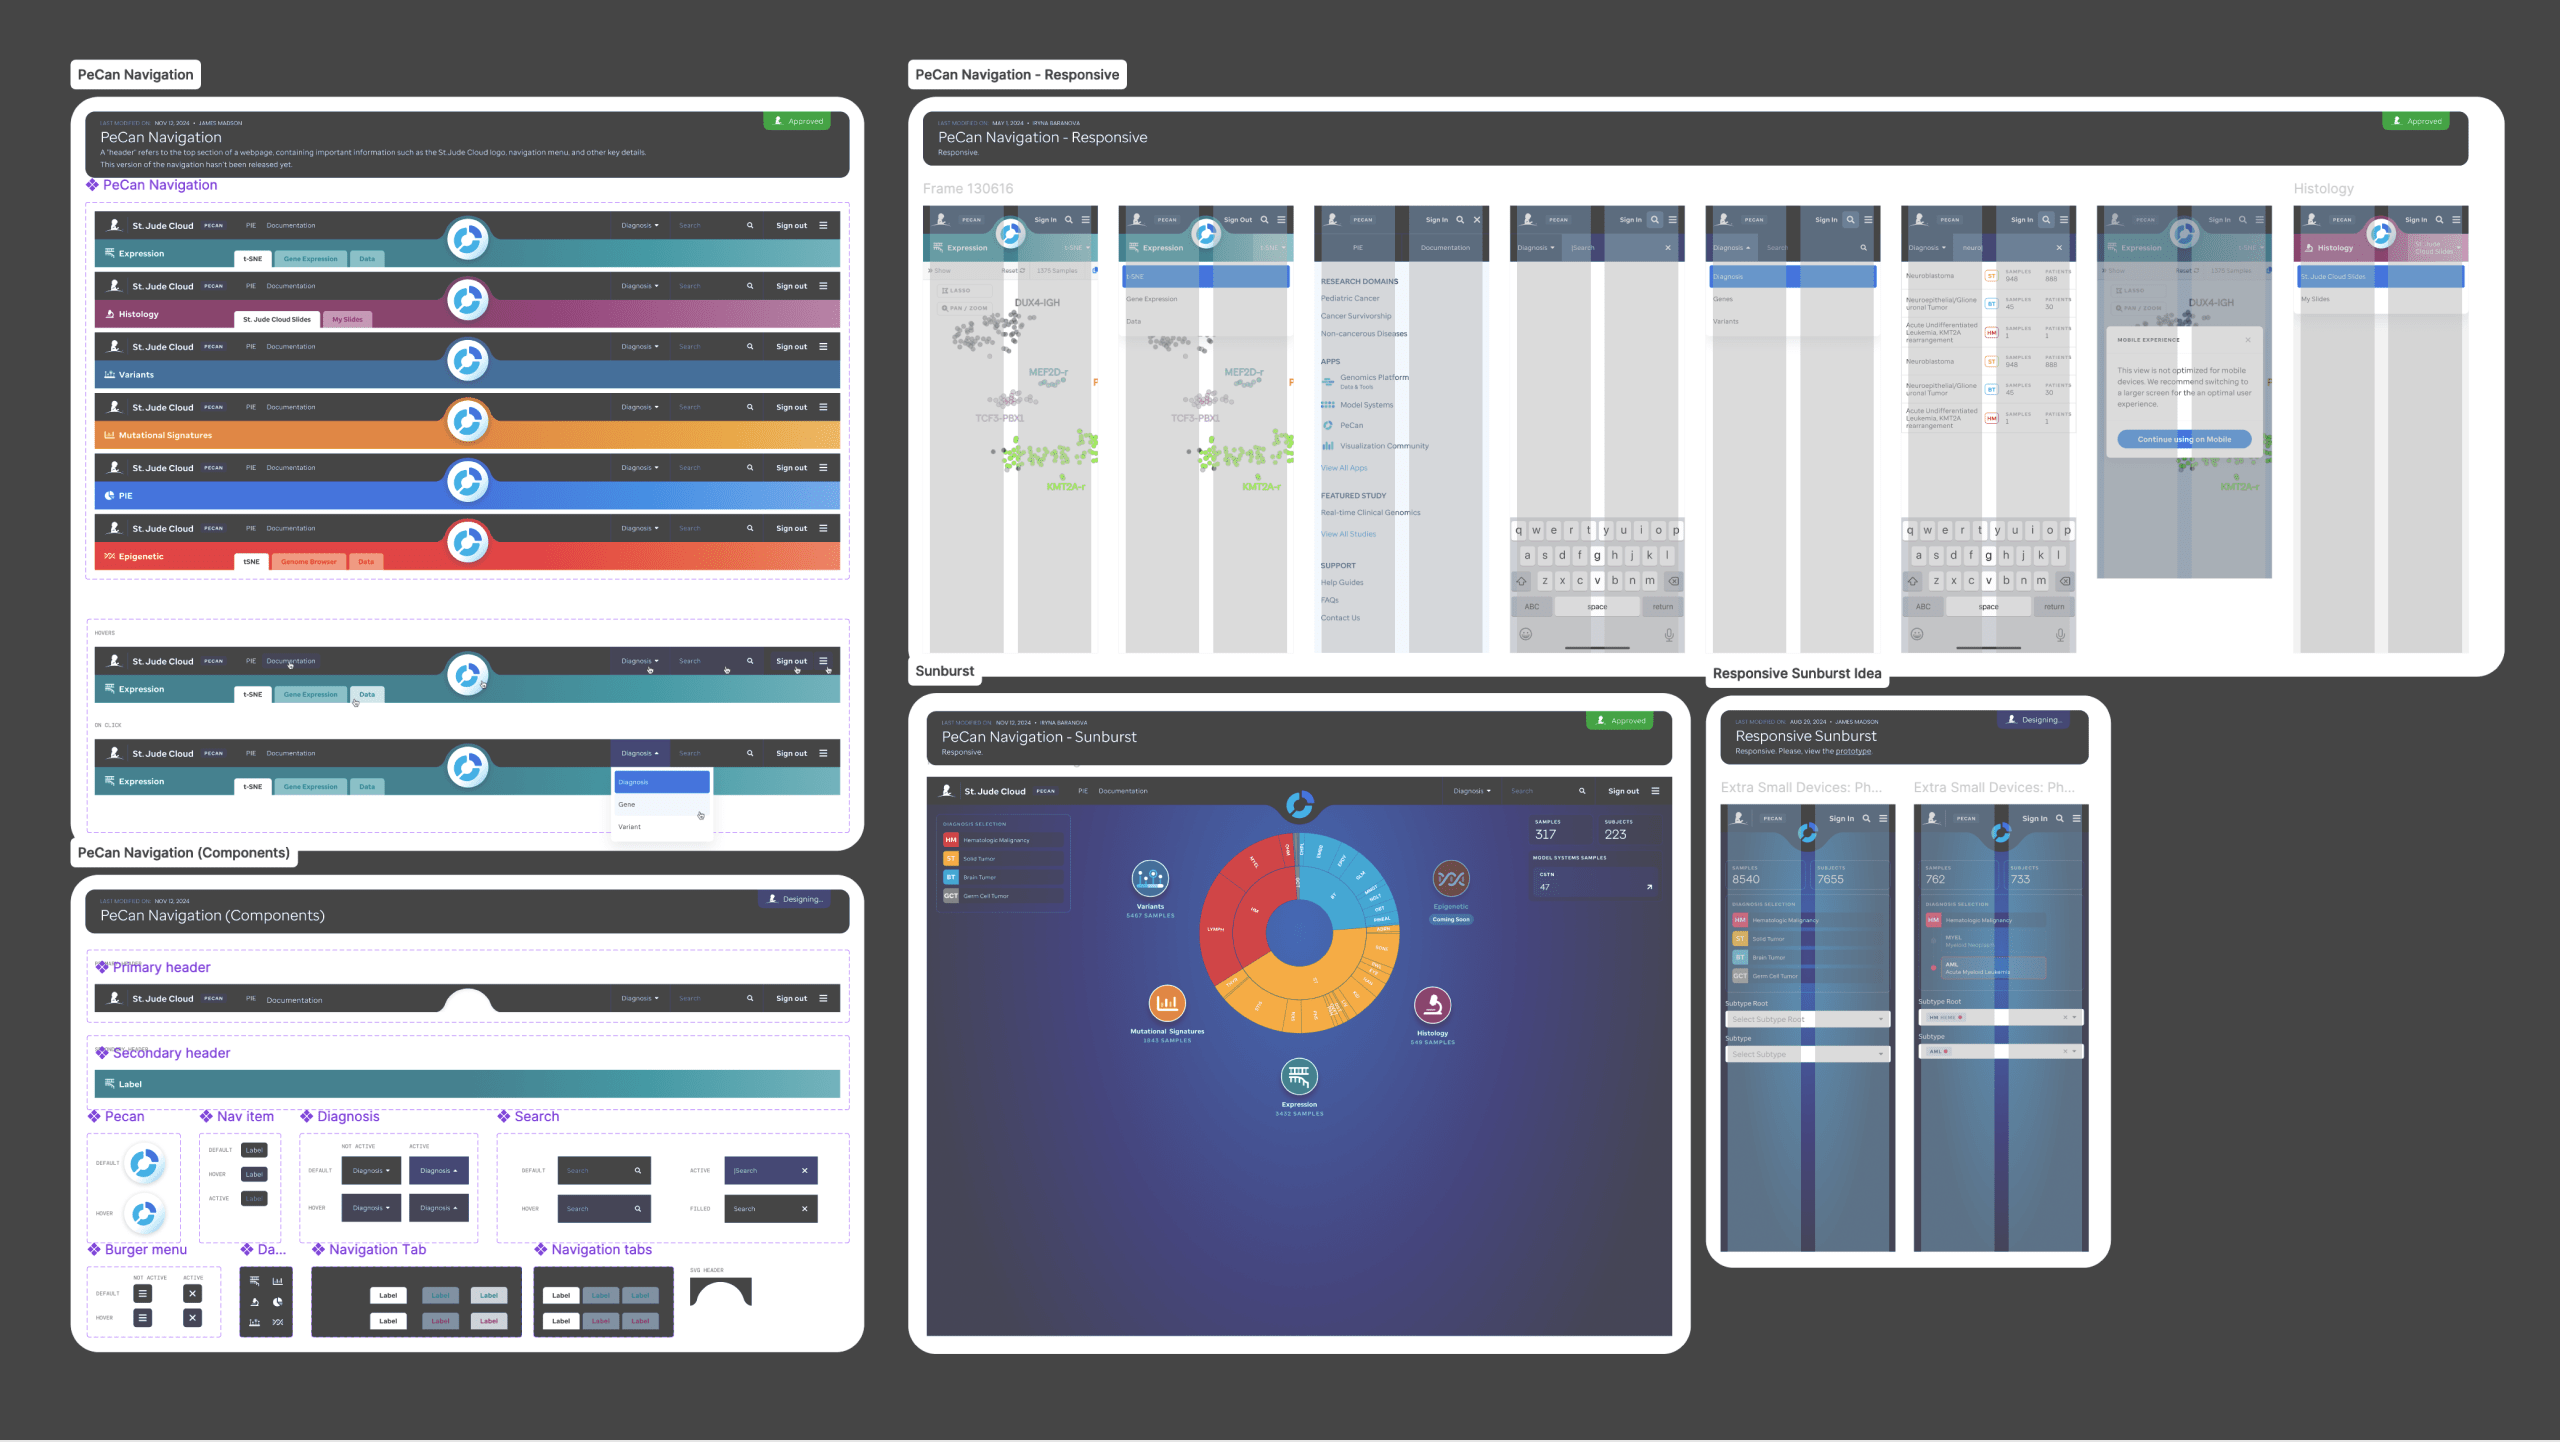 Design system navigation components
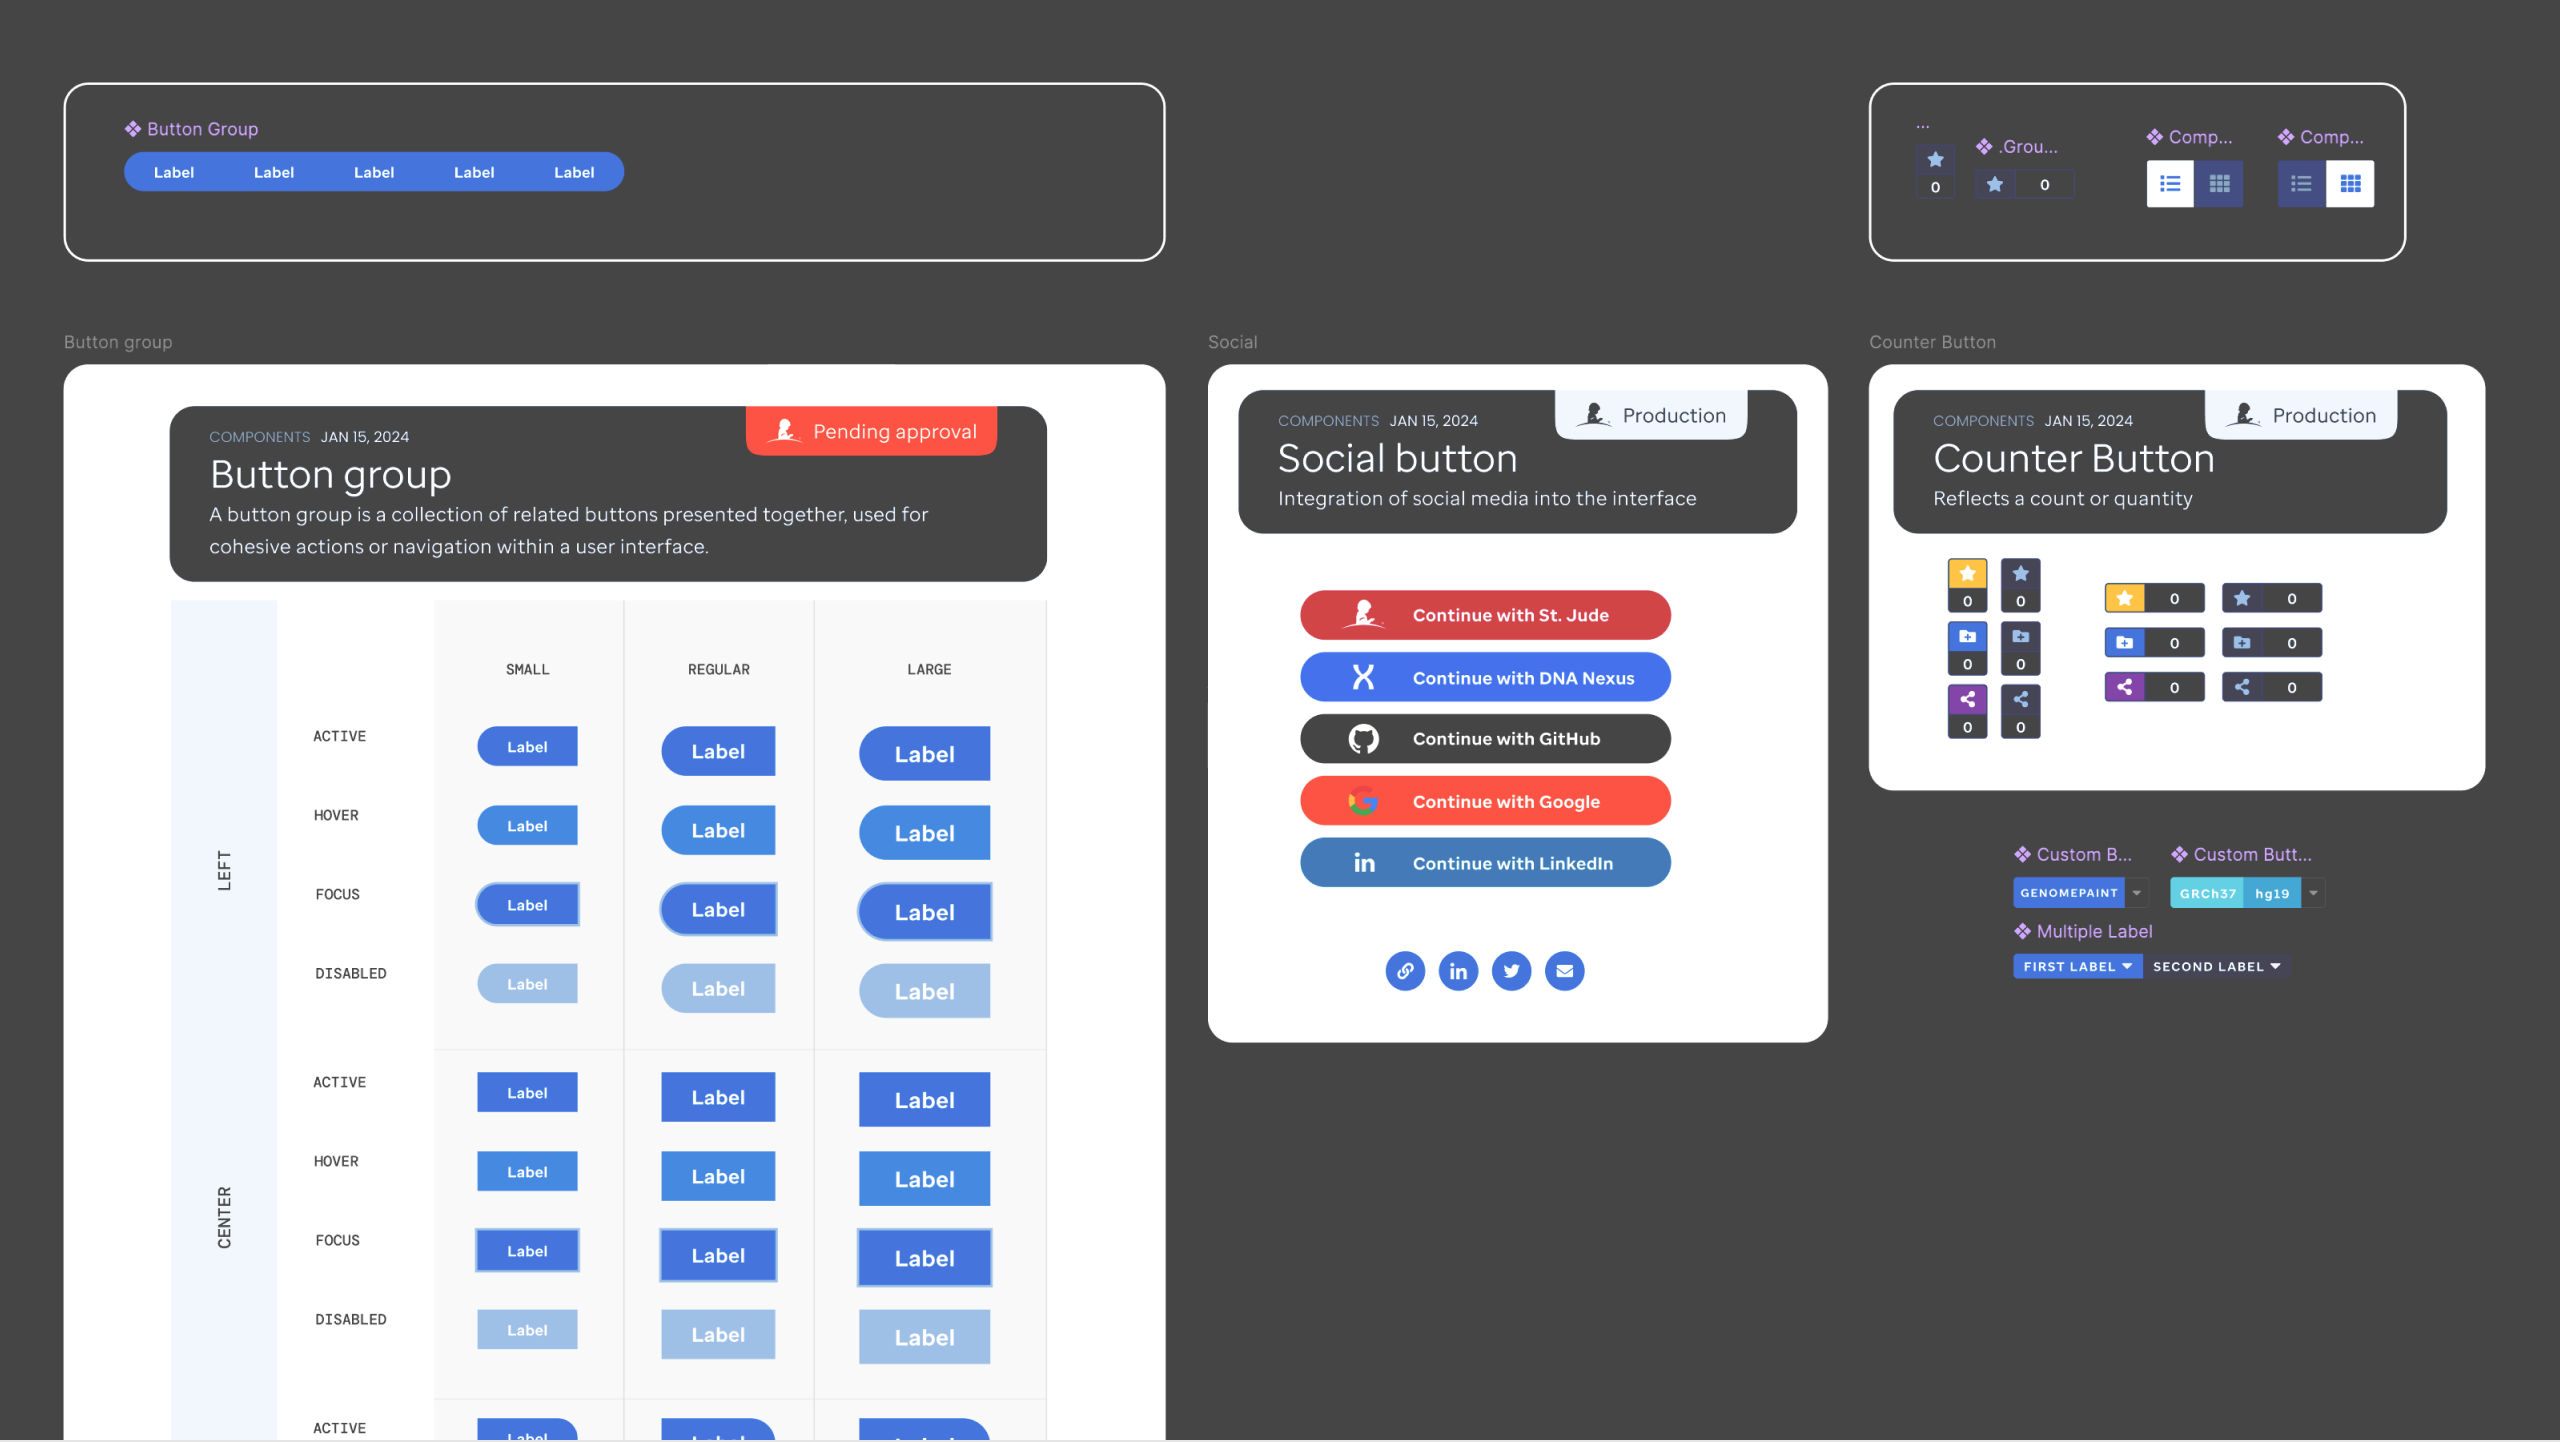 Design system buttons
 Membrane toggle UI component
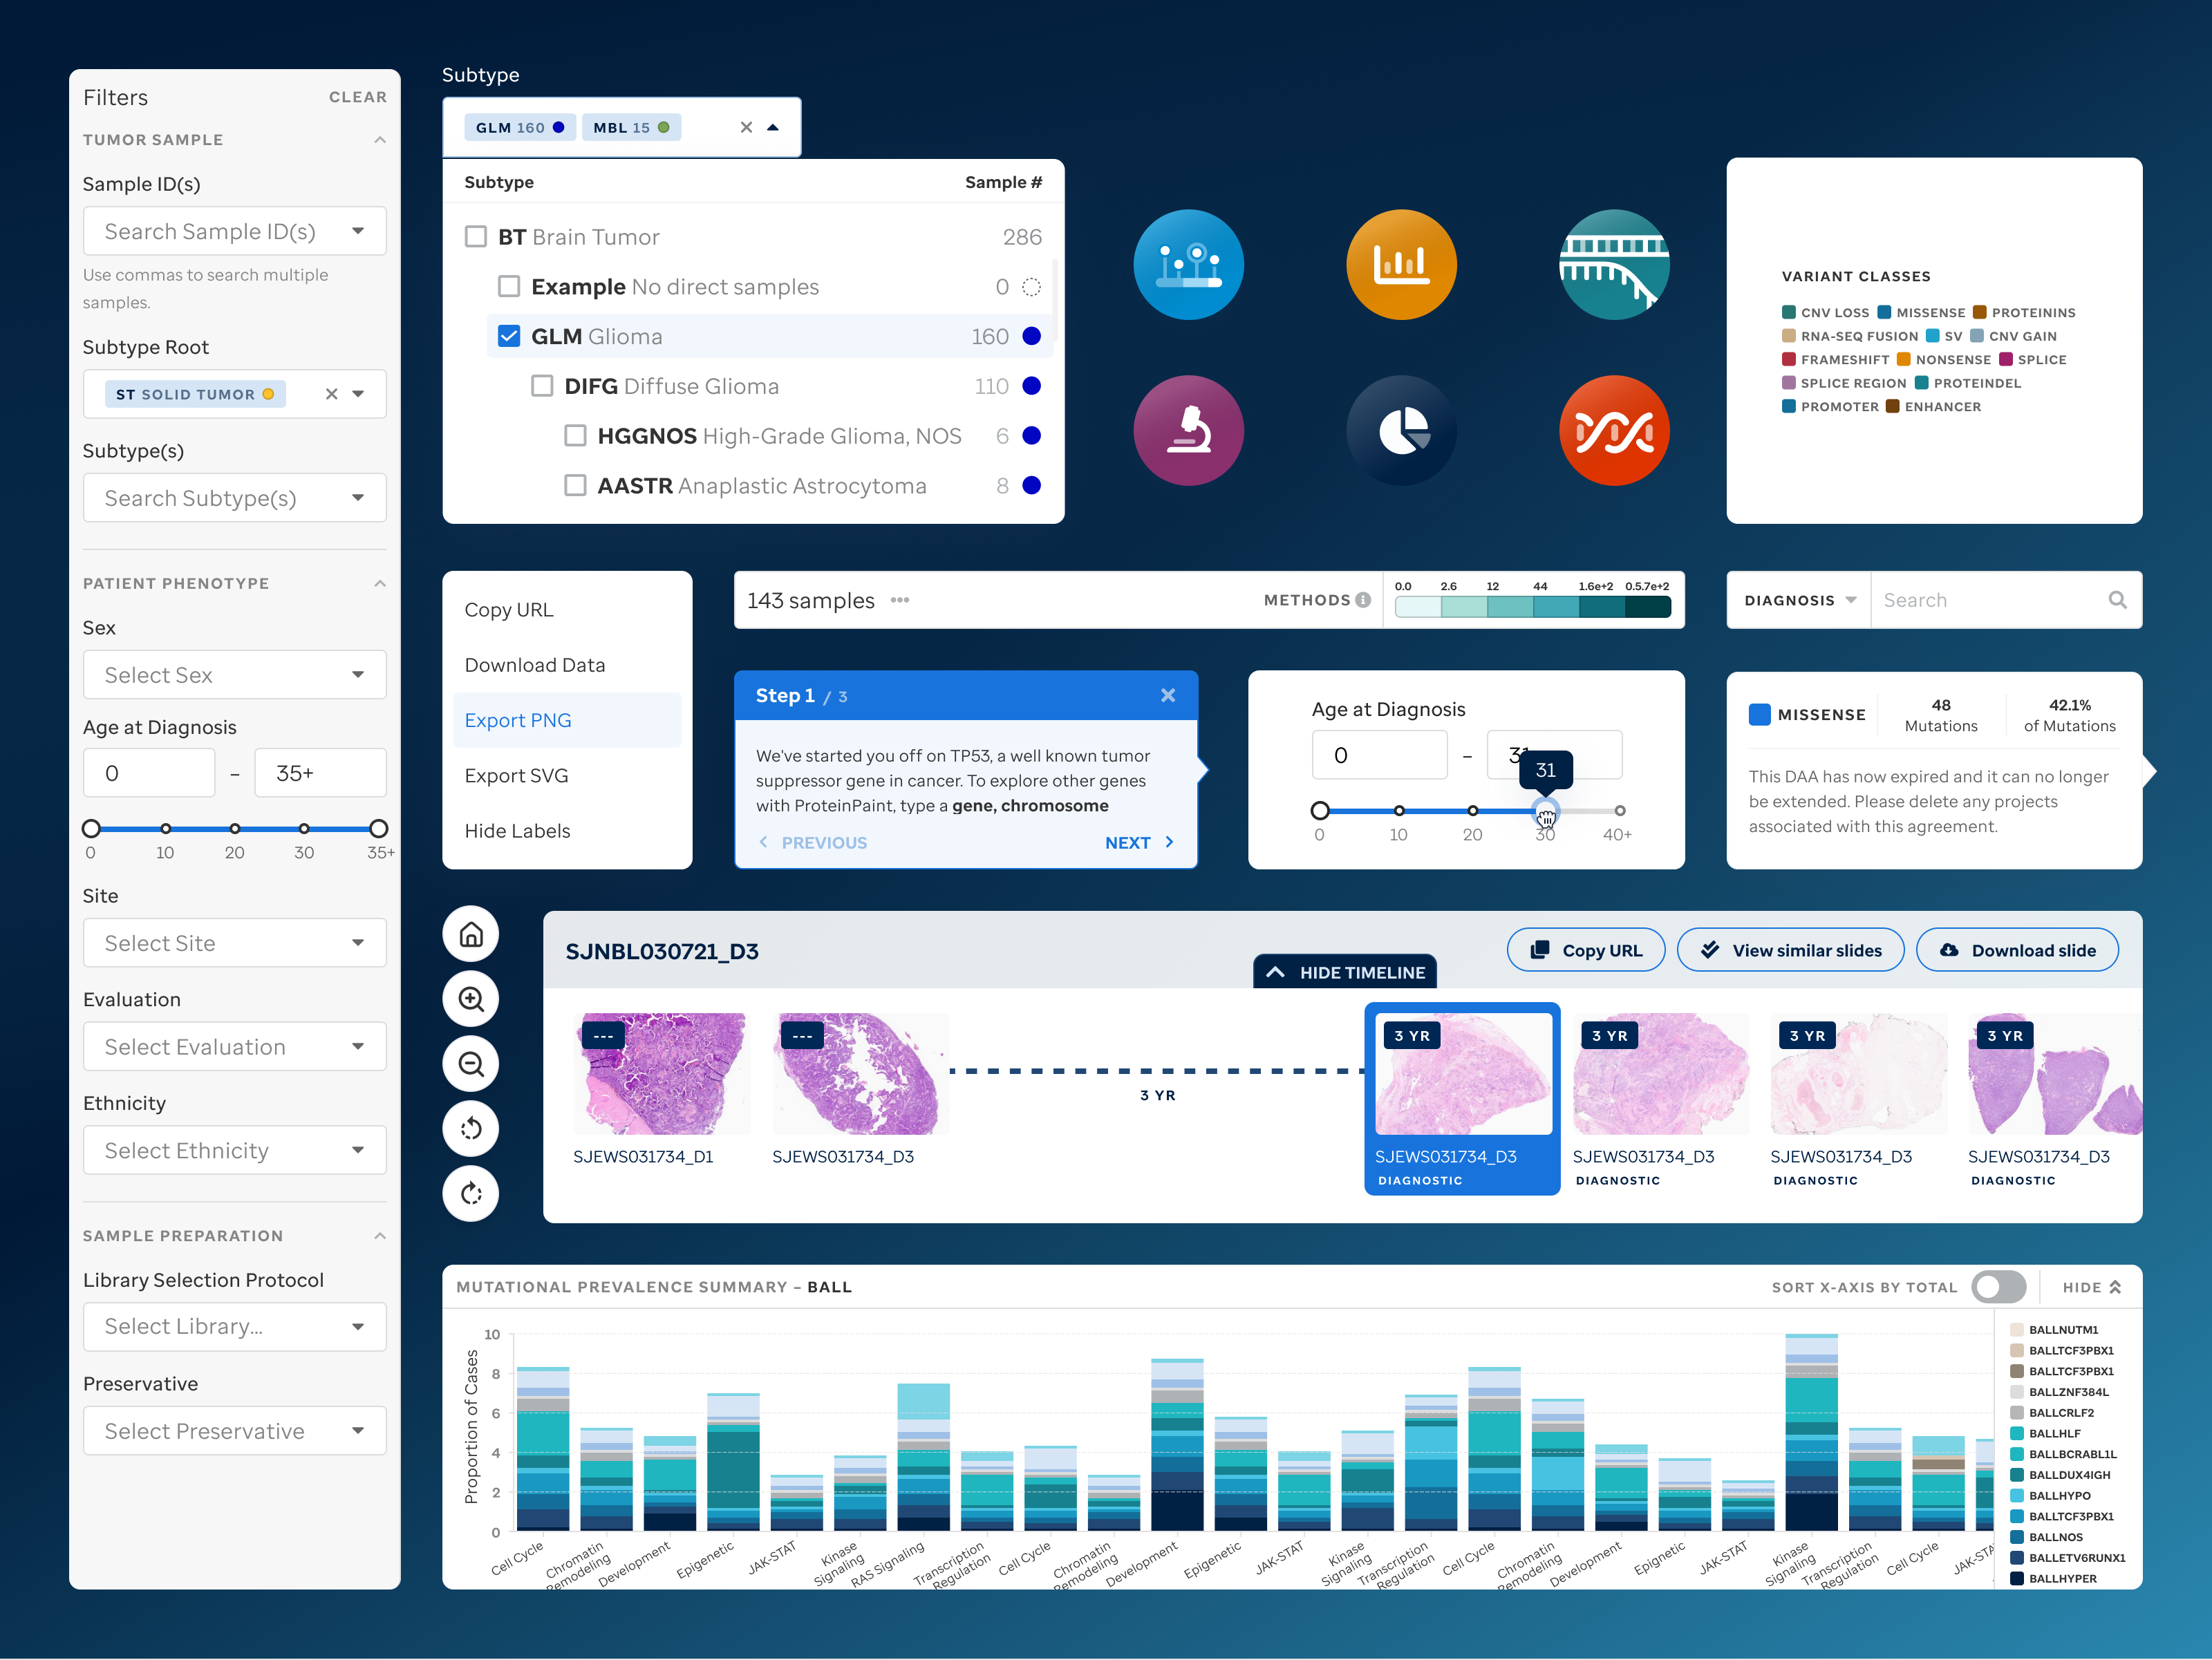 Image and kern UI element styles
Launch & Communication Support
Collaborated on launch planning, email newsletters, and feature rollout strategy—ensuring the new PeCan was introduced with clarity and cohesion.
 Data table presenting the data available within the PeCan platform
 Presentation slide illustrations for launch communications
Design
We replaced dense tables and long lists with flexible data views that help users uncover relationships between datasets, diagnoses, and publications. Interactive elements guide researchers through complex results without overwhelming them.
The new interface emphasizes clarity and readability through structured grids, soft neutrals, and gentle gradients—balancing scientific precision with approachability. Each page was restructured for improved navigation and user focus.
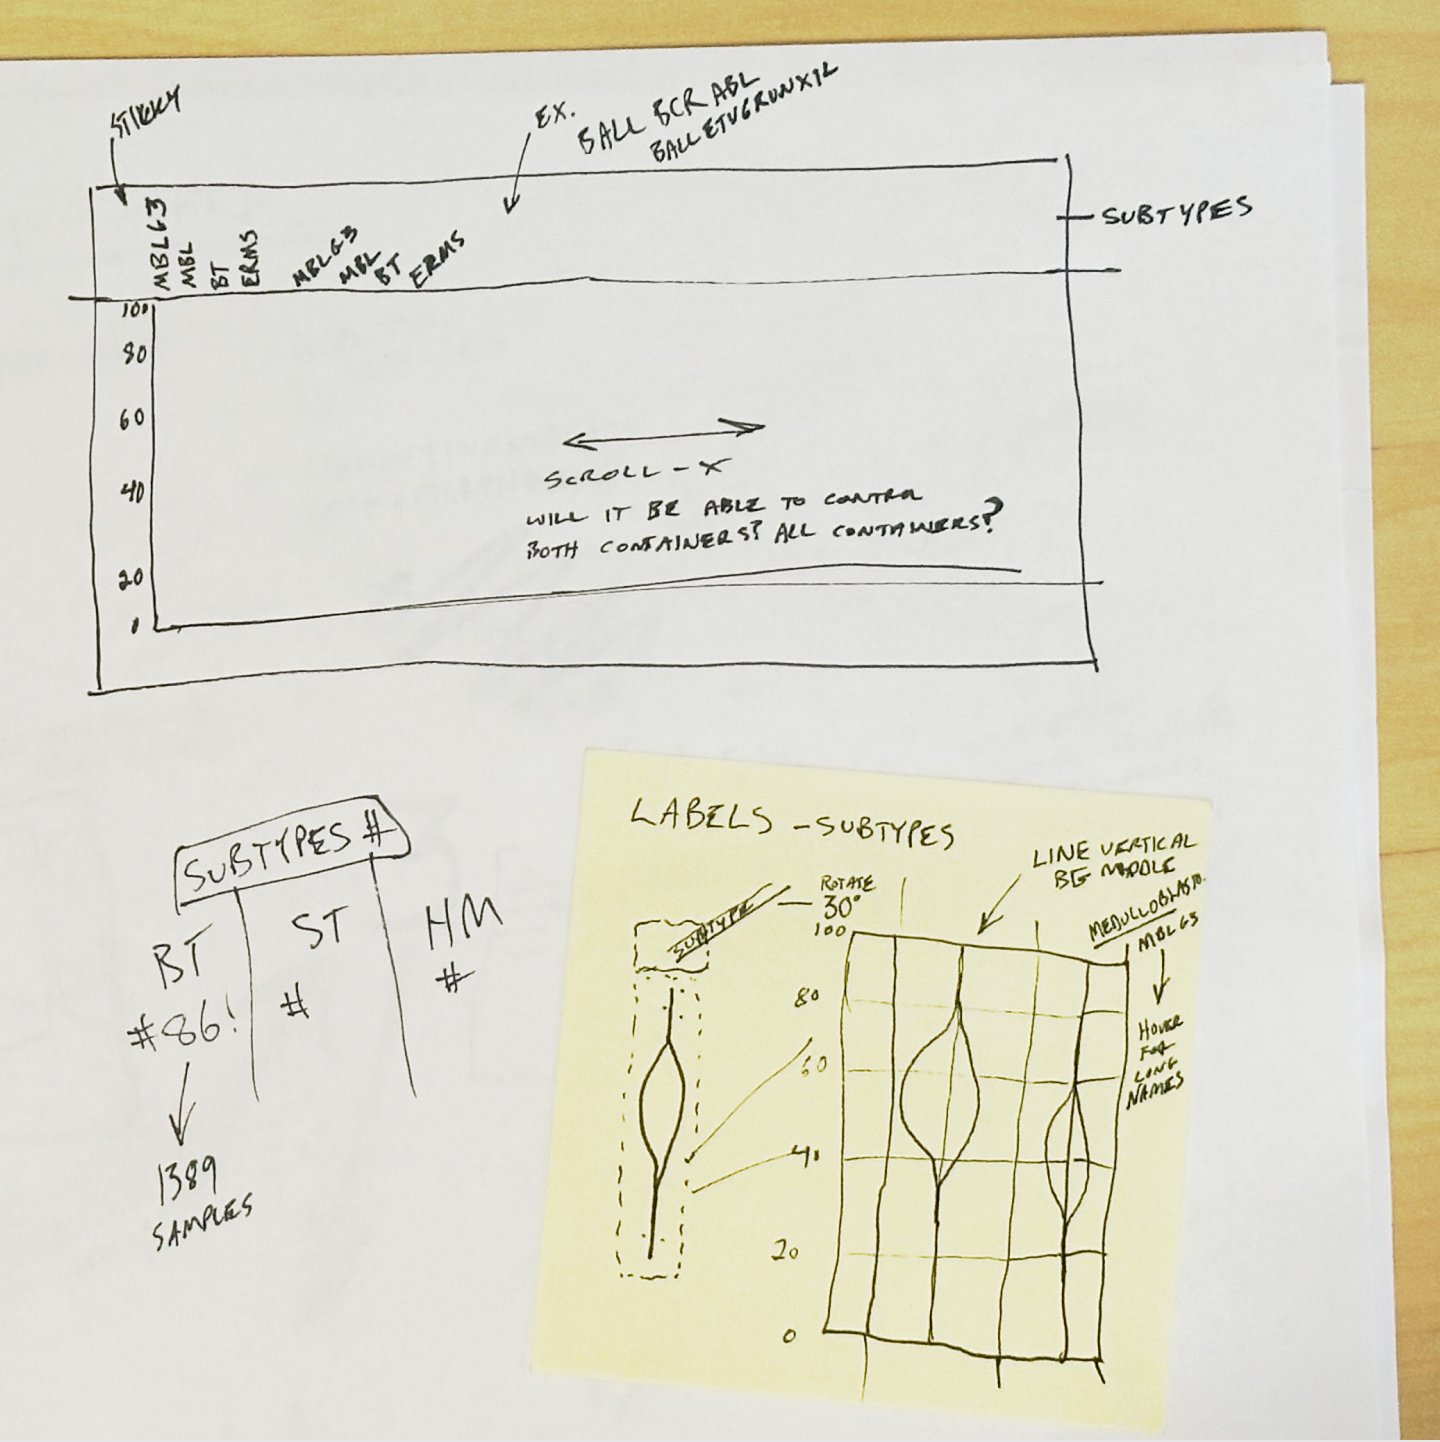 Early sketch for displaying multiple gene's expressions across subtypes
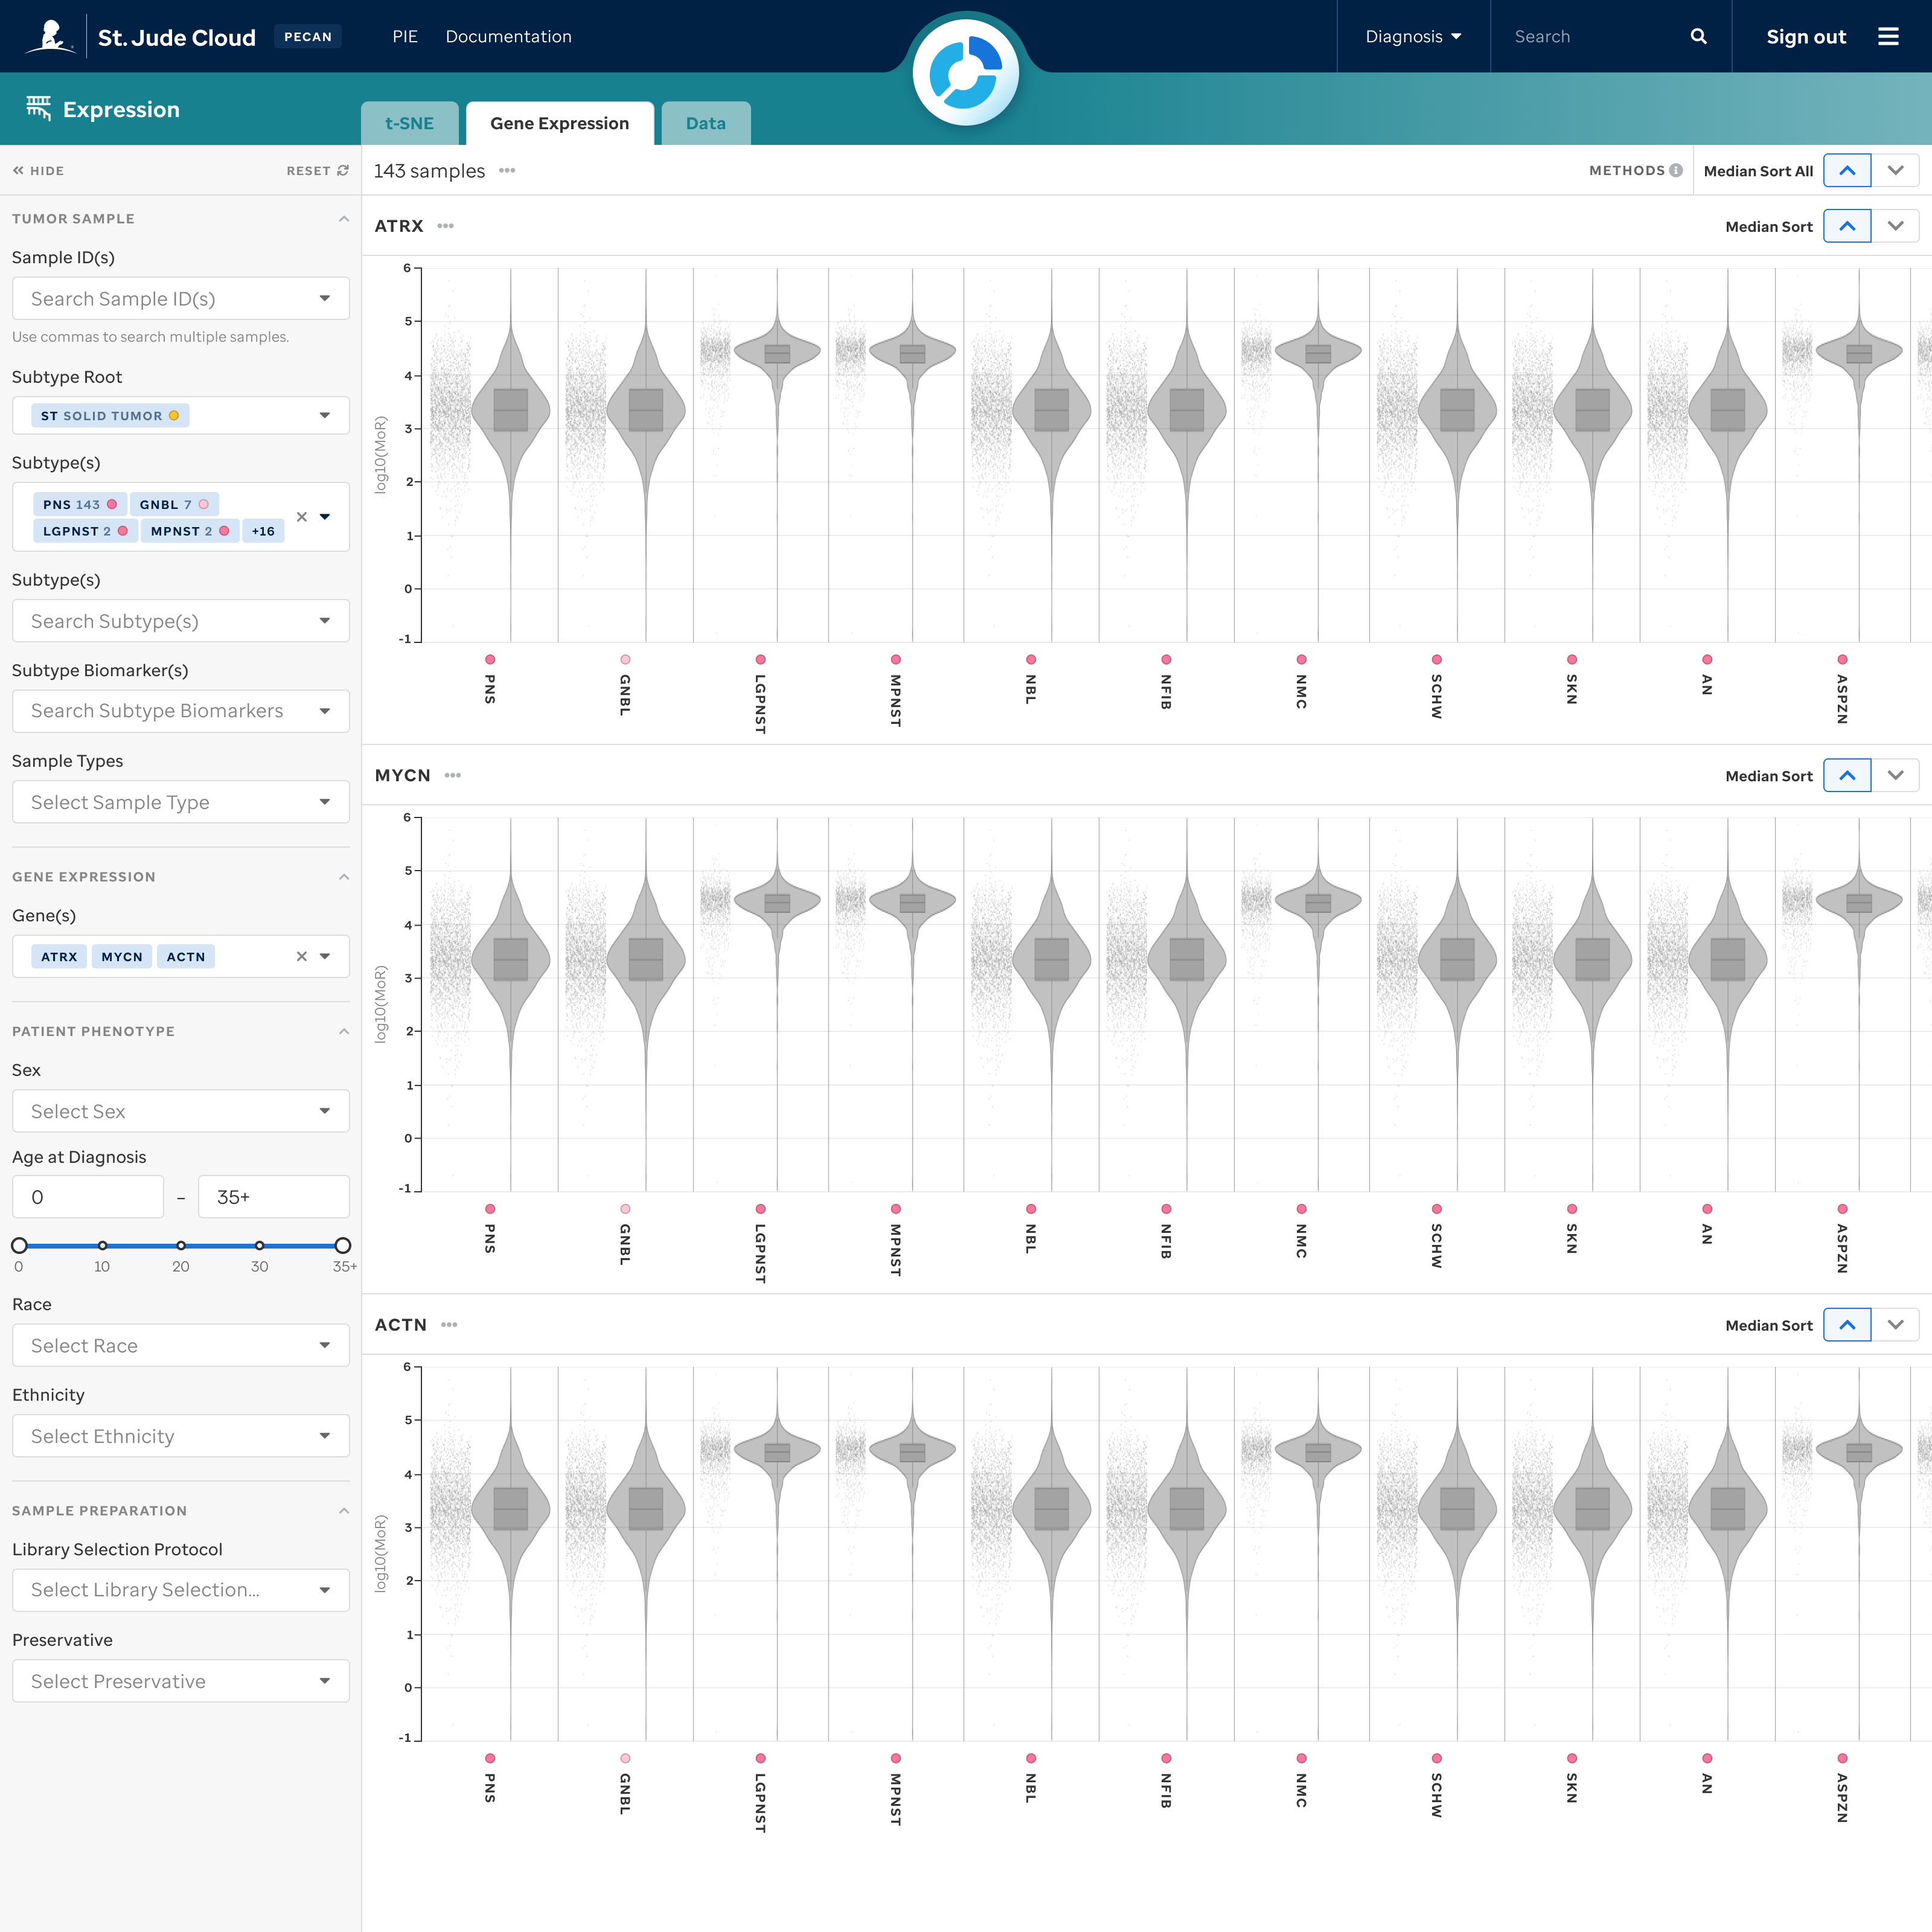 Expression data facet's compact display of gene expression for multiple genes across subtypes
There were a lot of dense bar charts. Between contextual visibility, colors, and orientation these provided massive amounts of data in a small space.
Expression data facet's compact display of gene expression for multiple genes across subtypes
There were a lot of dense bar charts. Between contextual visibility, colors, and orientation these provided massive amounts of data in a small space.
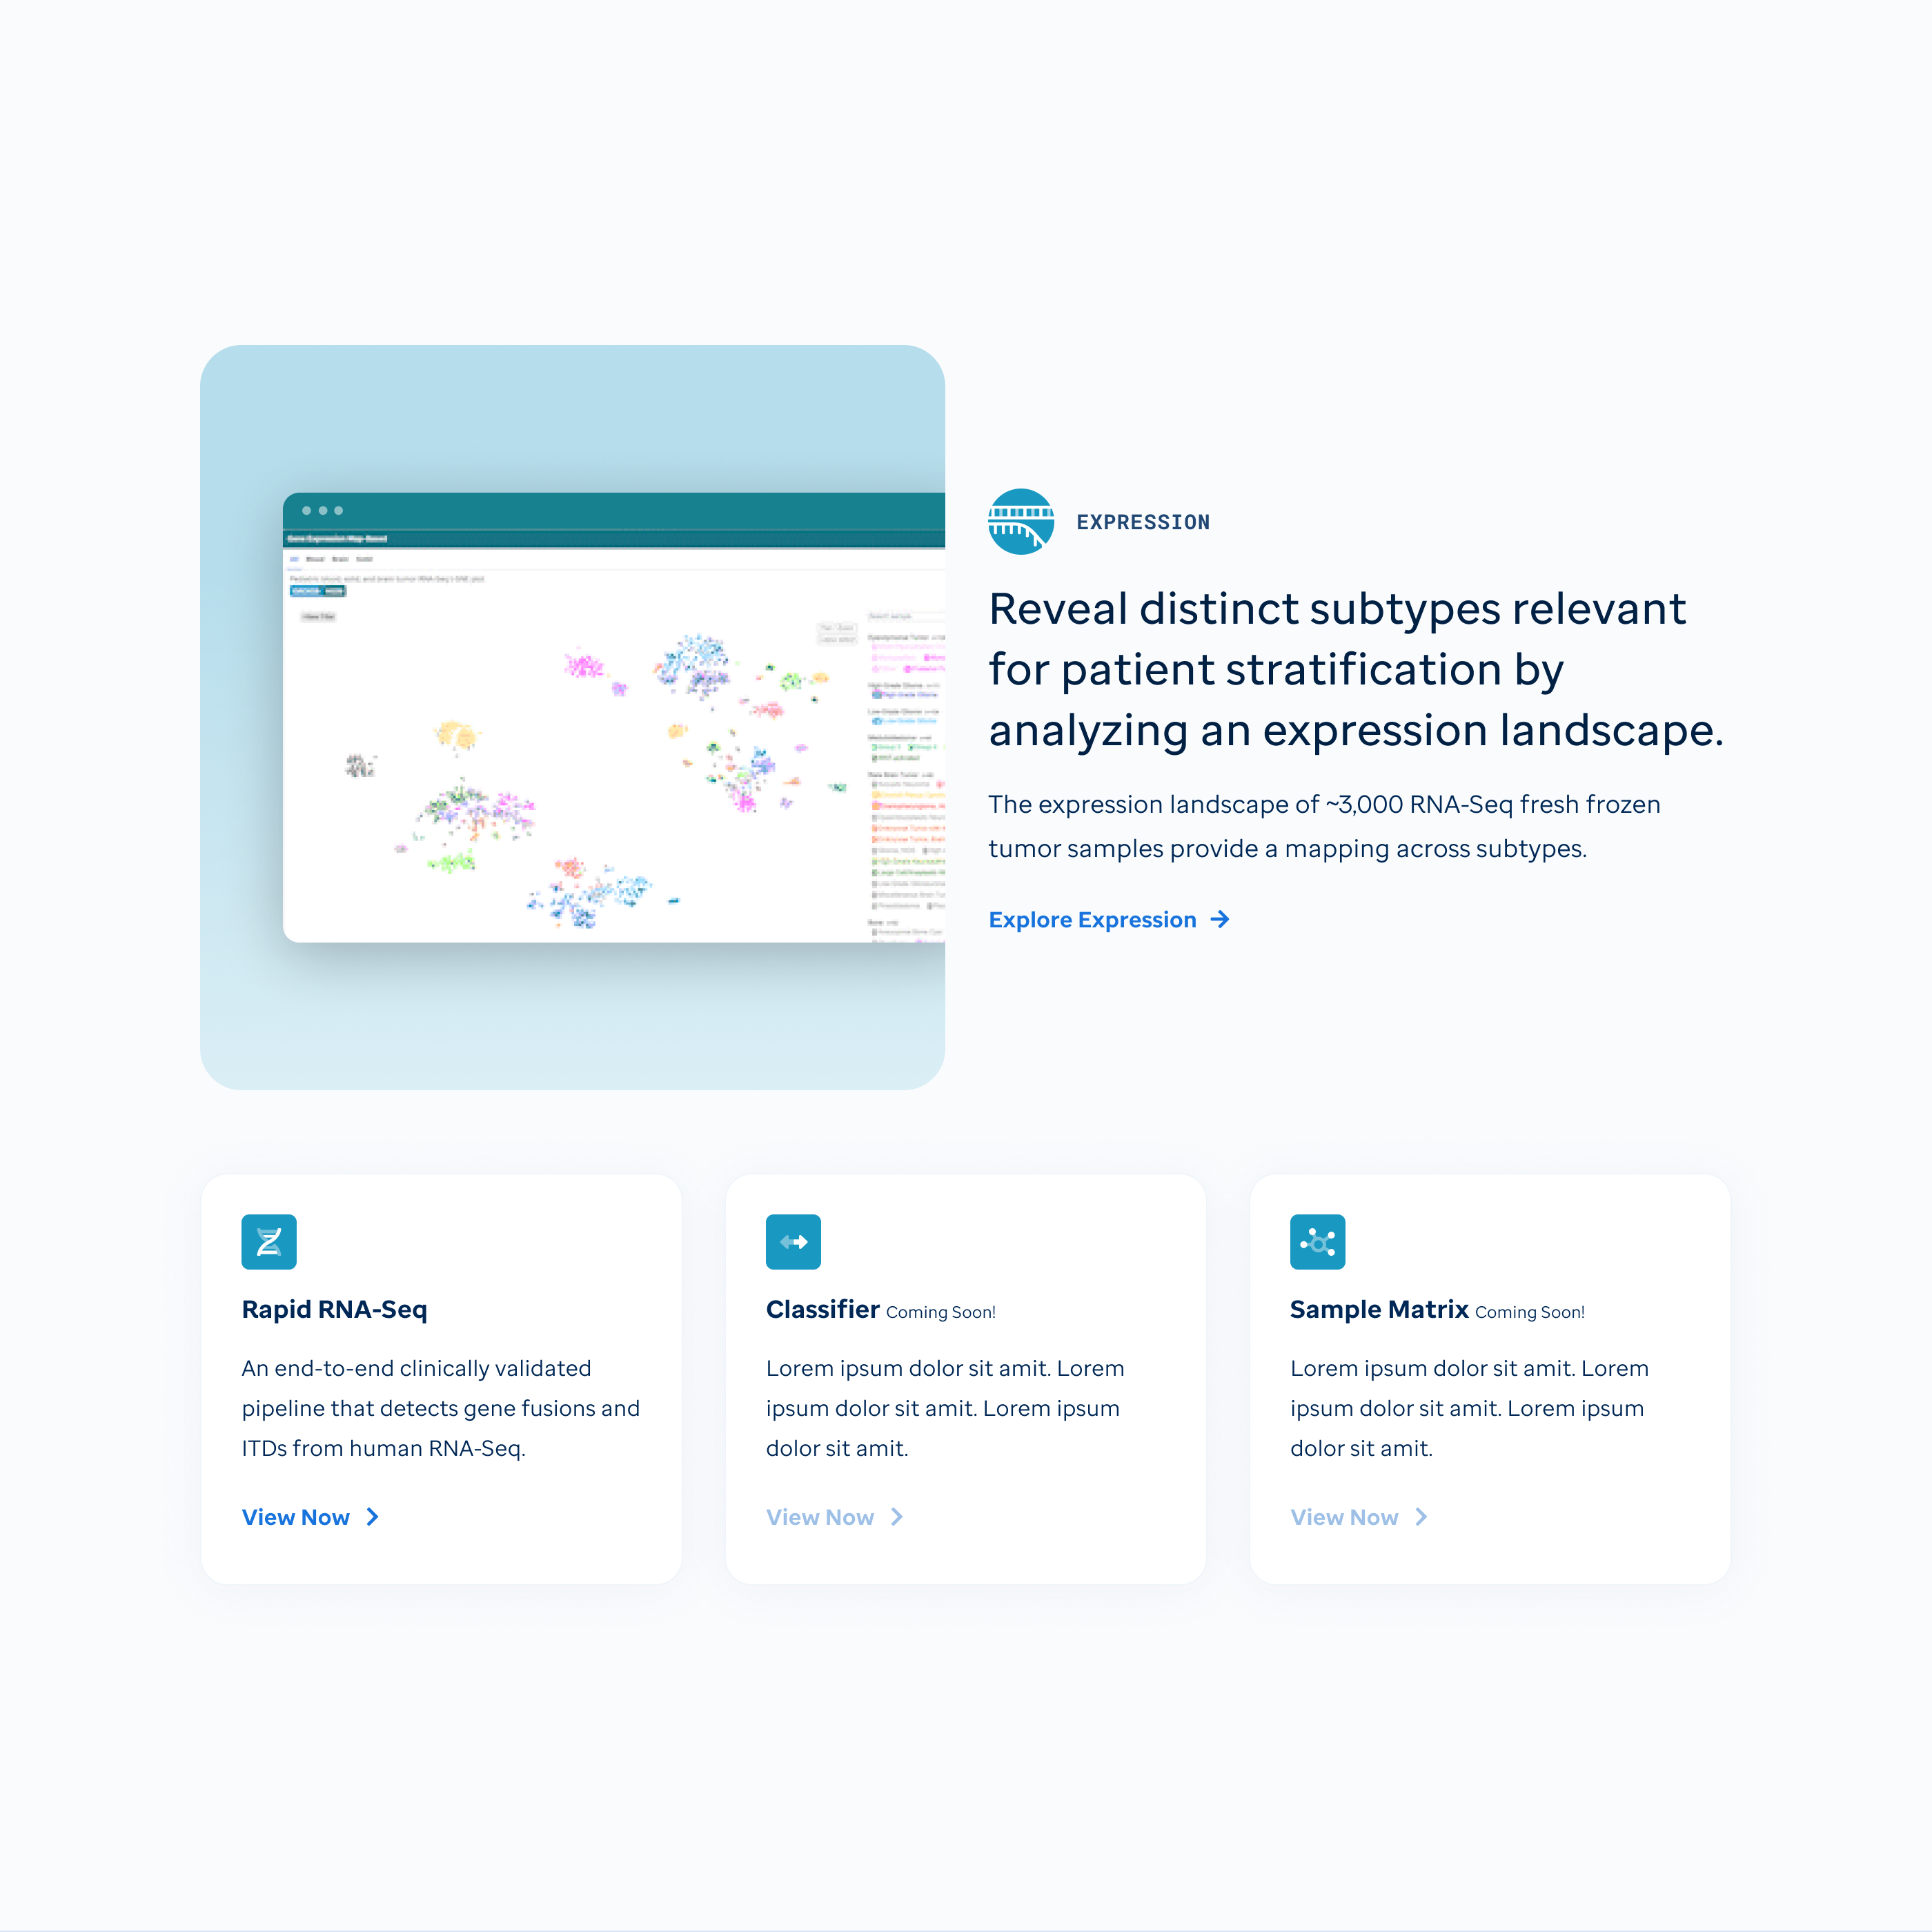 Expression data facet homepage
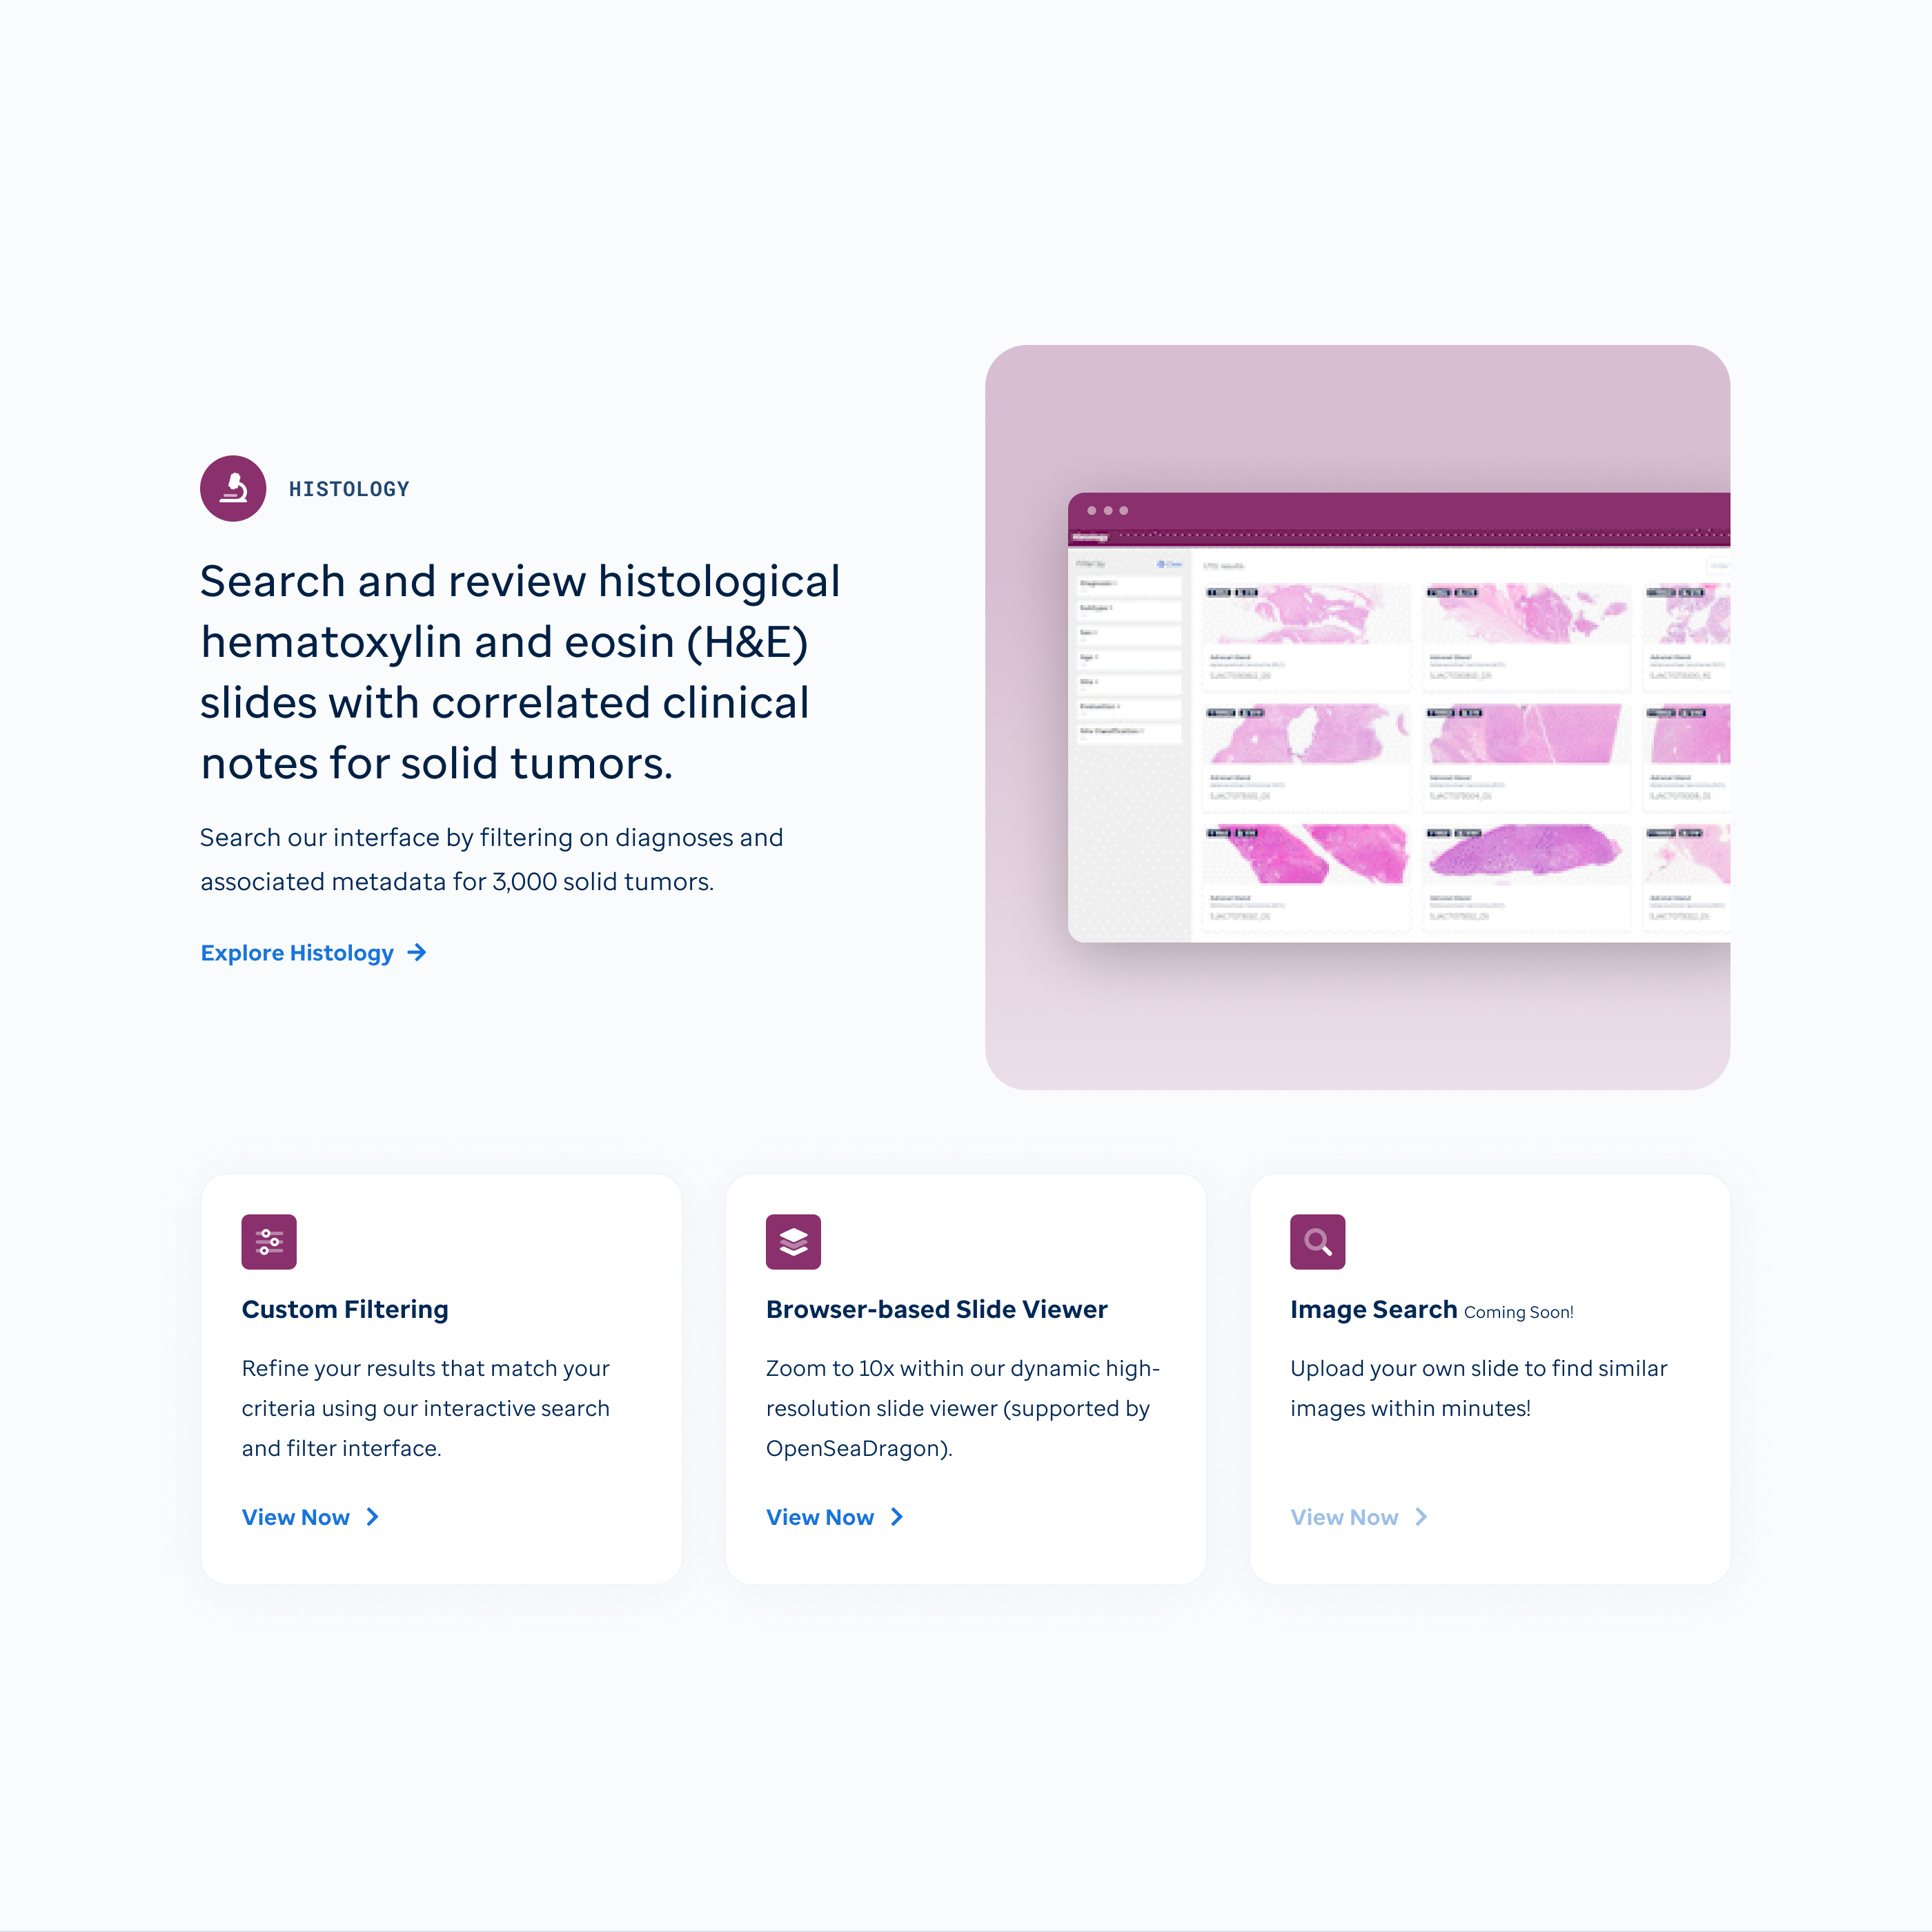 Histology data facet homepage
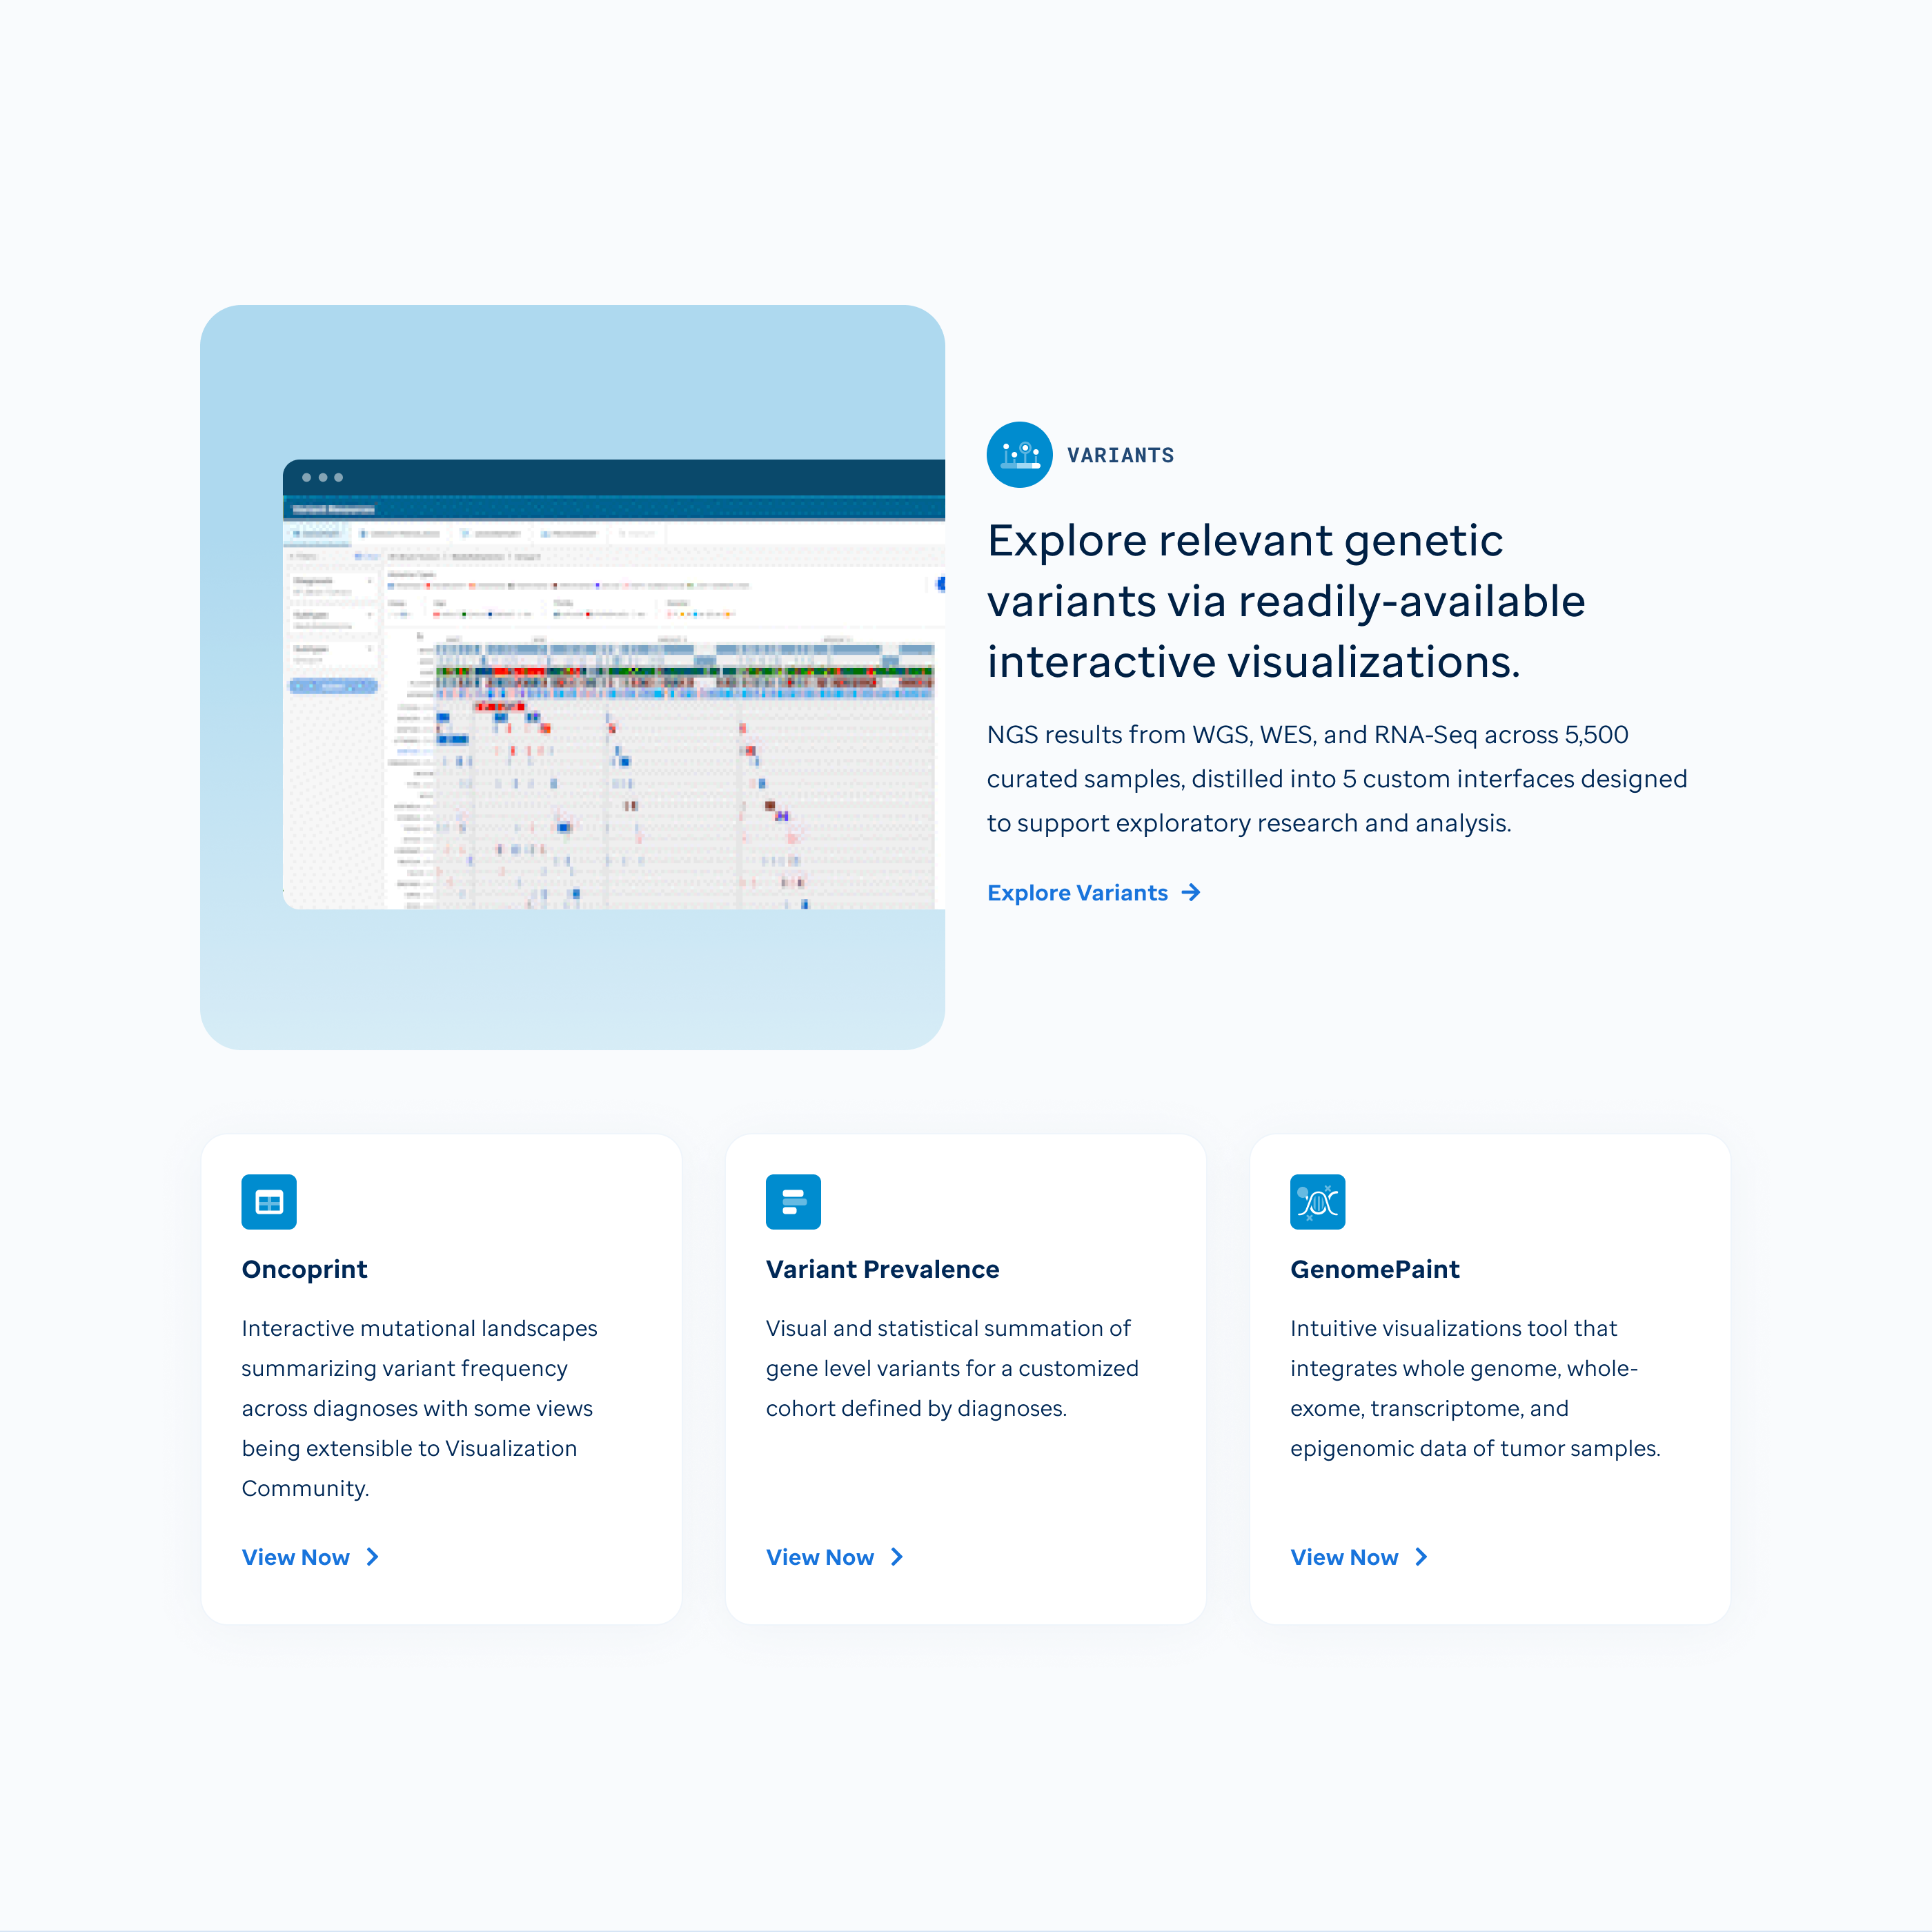 Variants data facet homepage
 Pie chart data summary view
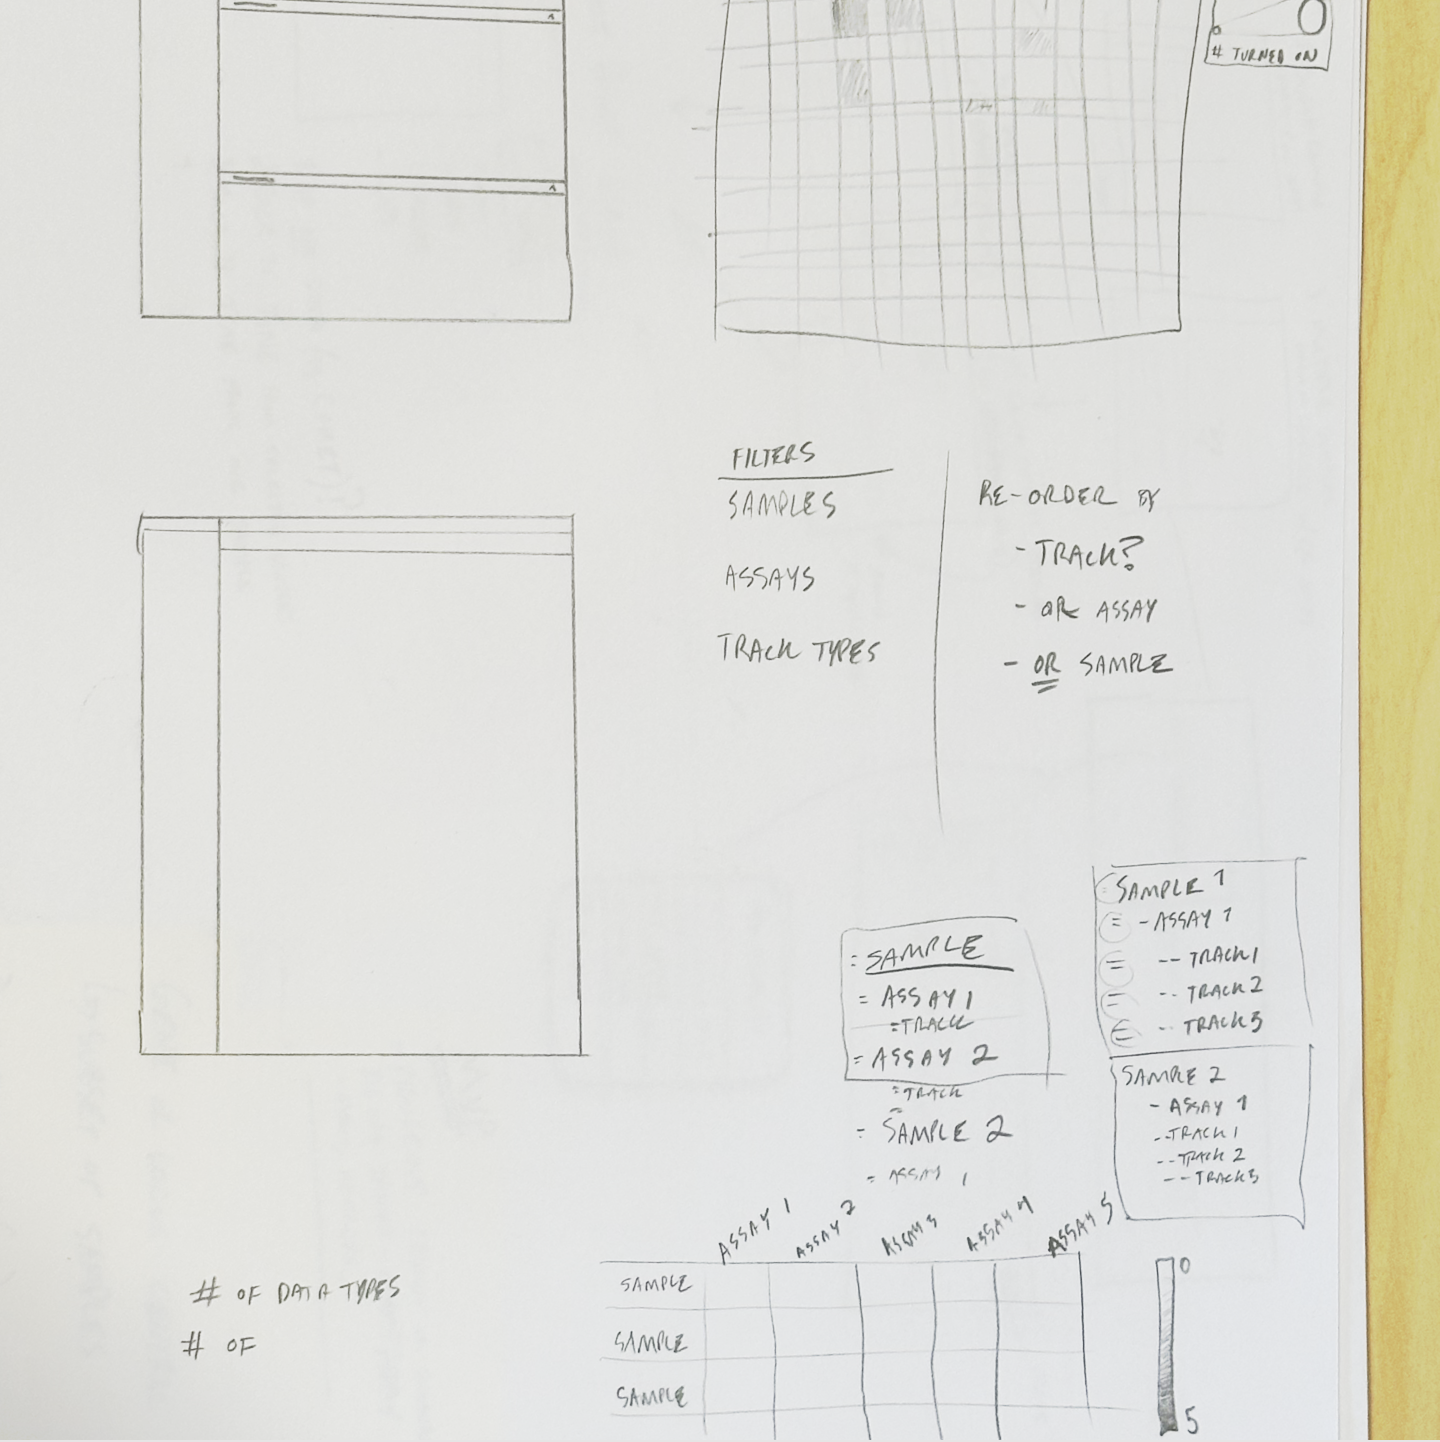 Early ideation sketches for assay data visualizations
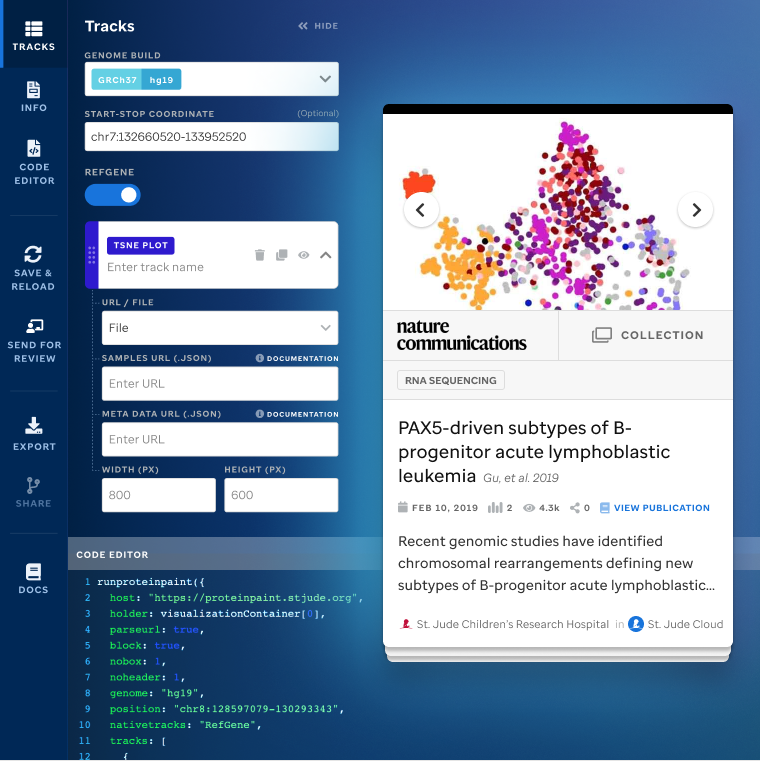
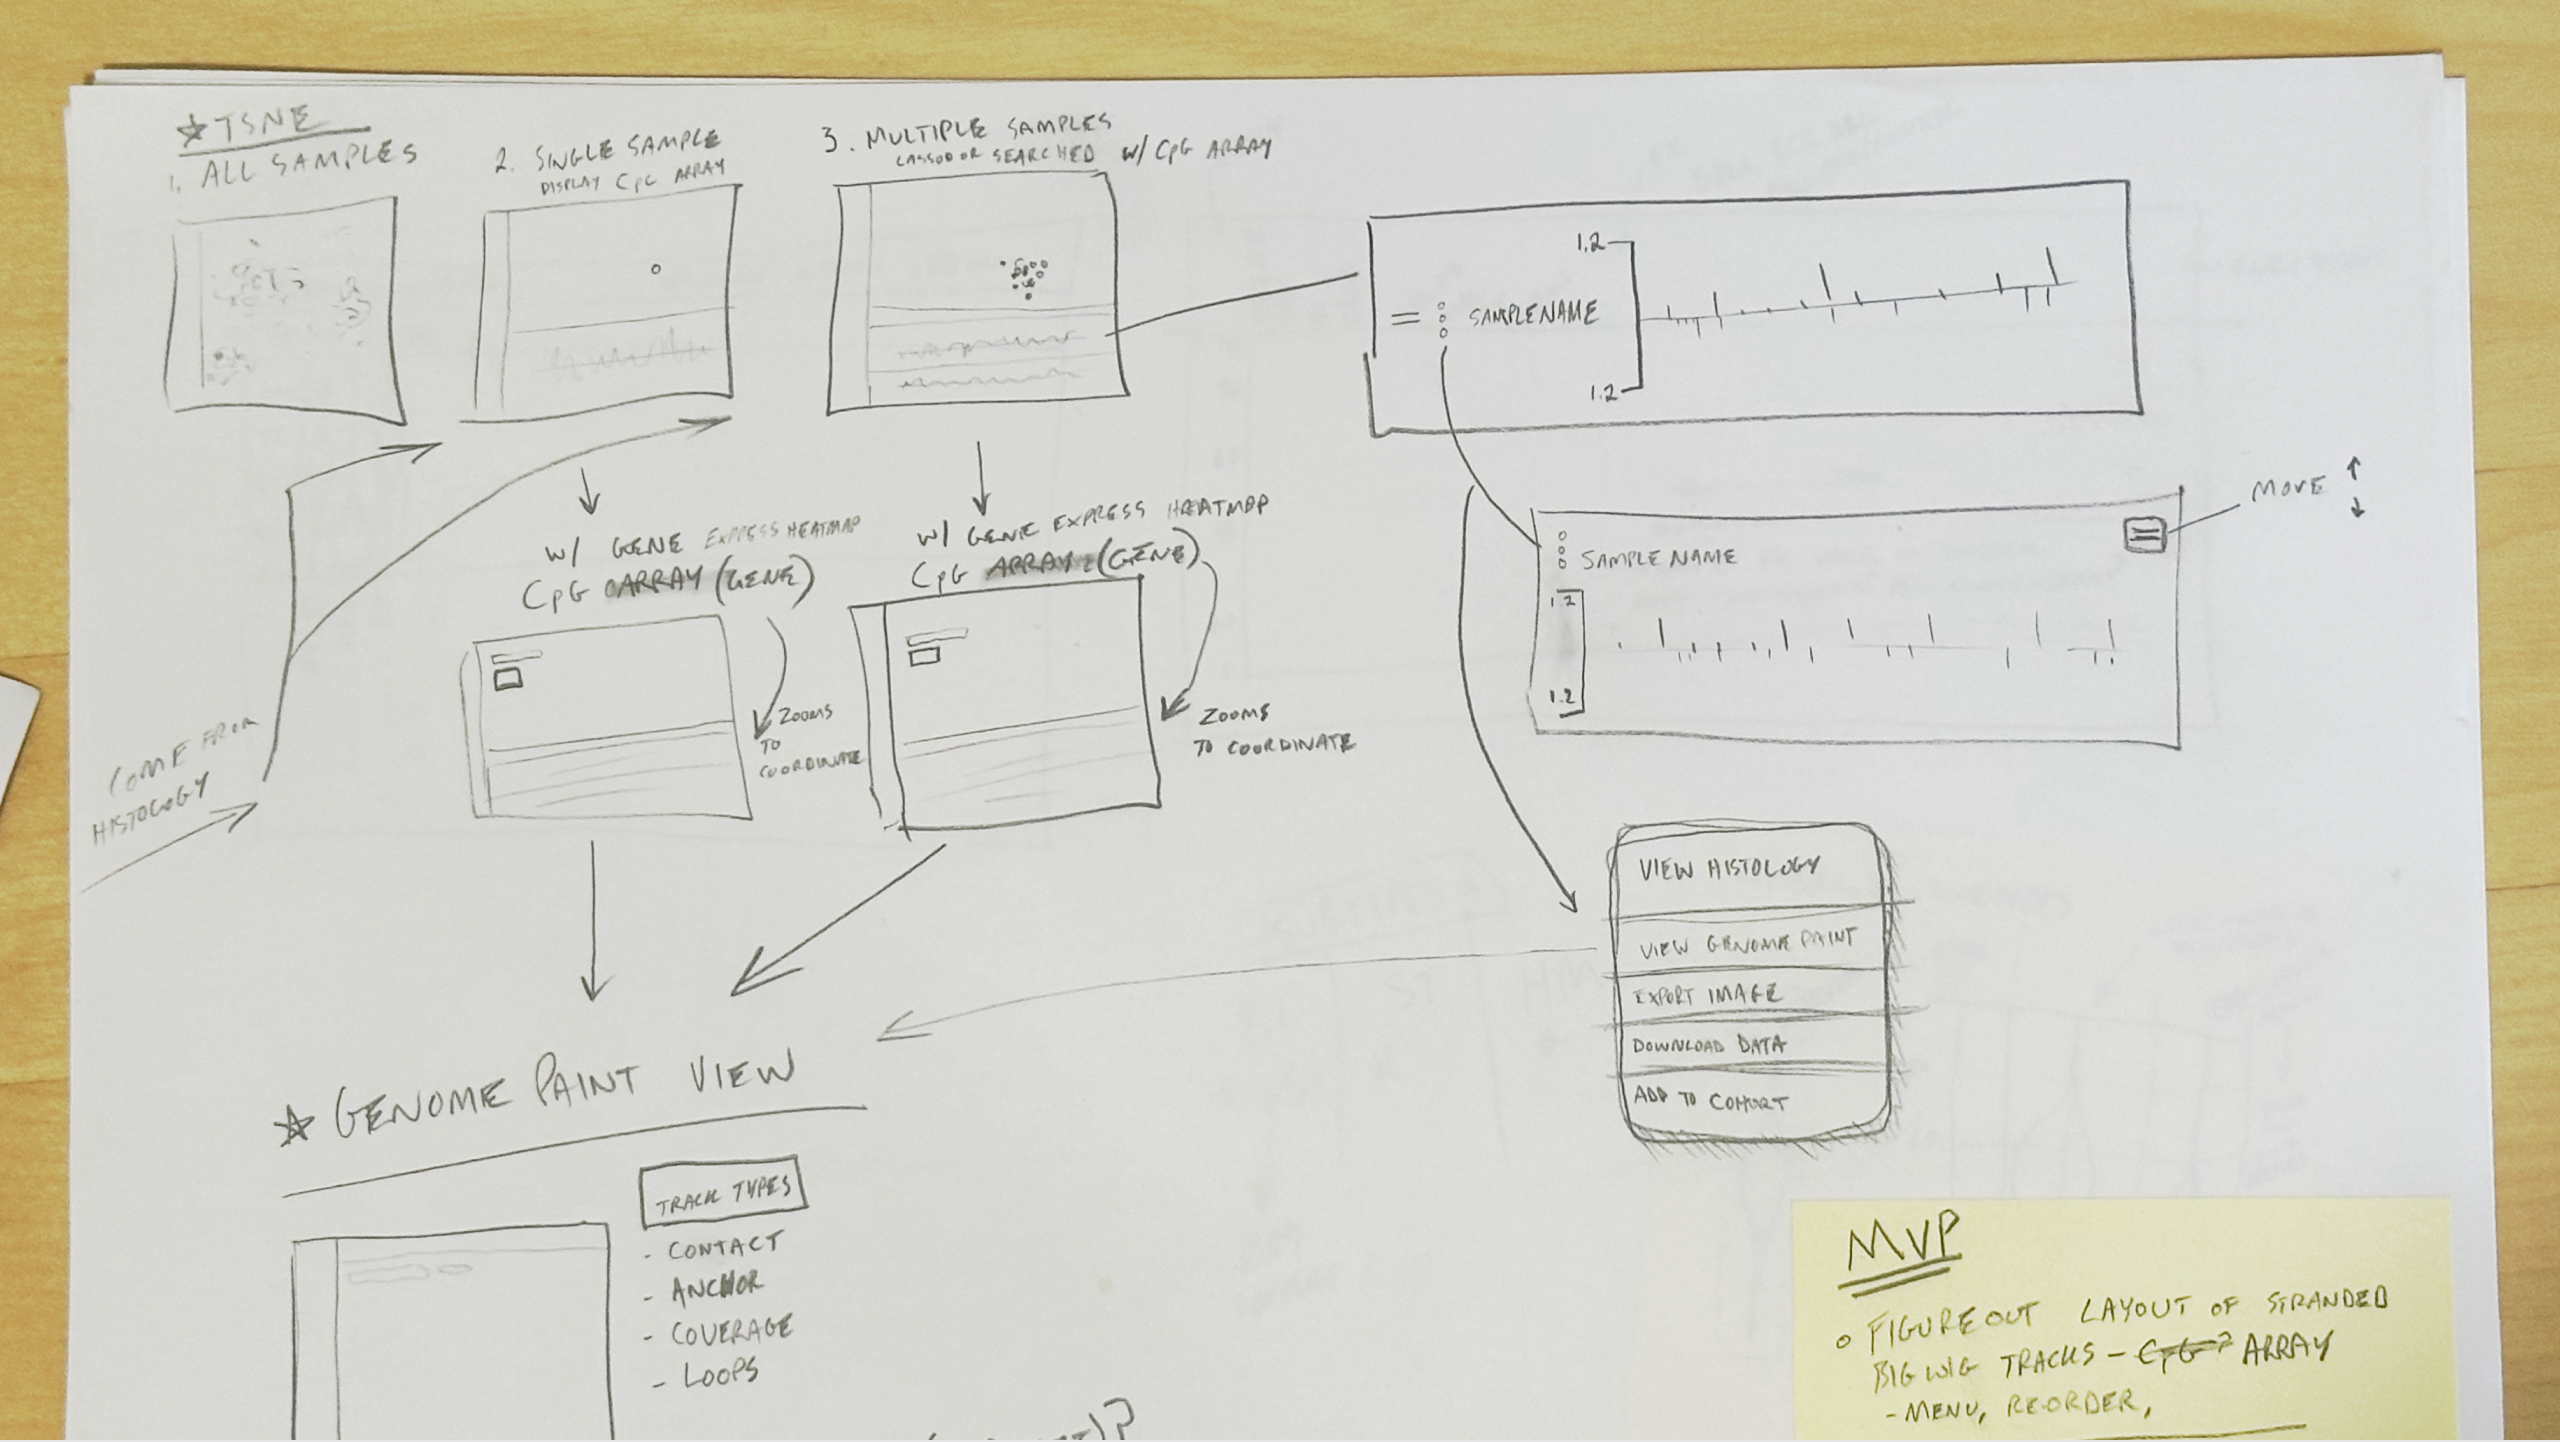 tSNE differential gene expression UX flow
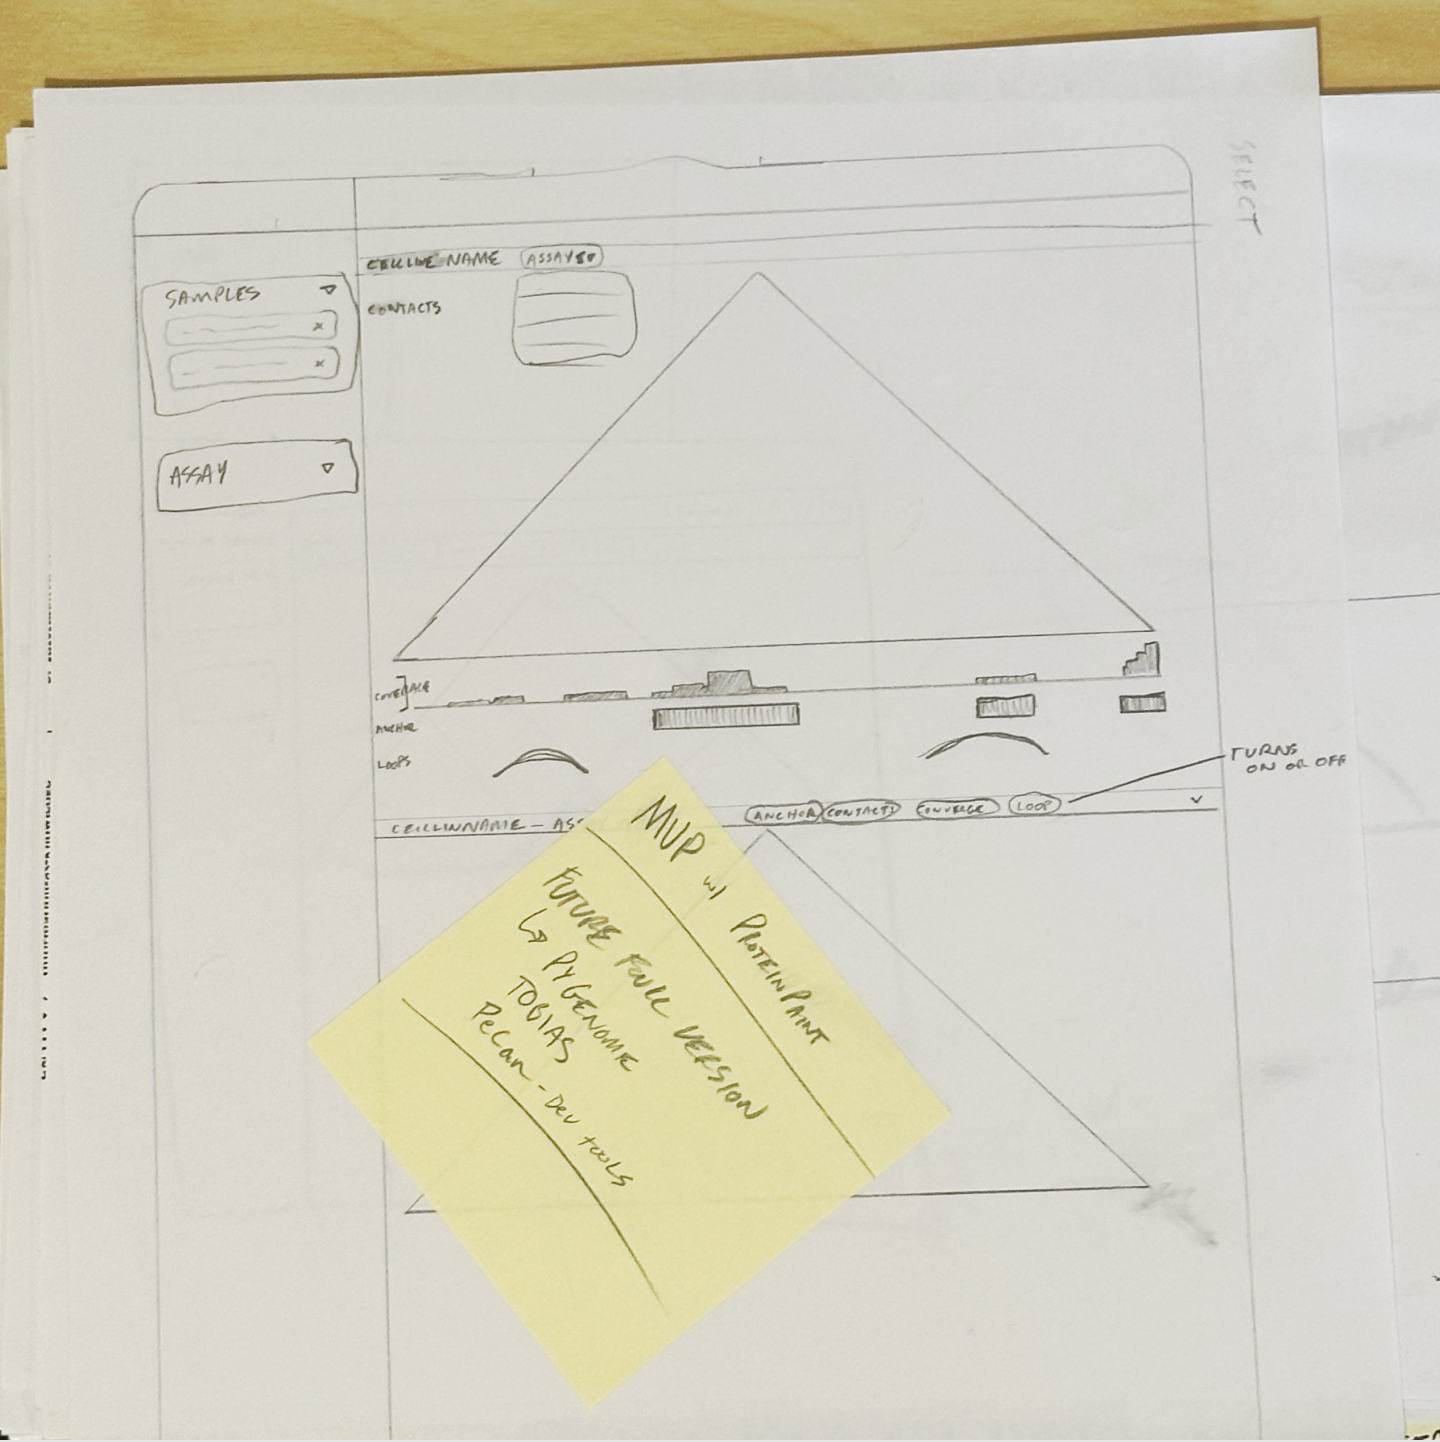 HiC data visualization sketch
 UX flow diagram for PeCan data facets
Cohort Building
One of PeCan's most powerful features is the ability to build and compare custom cohorts — grouping patient samples by diagnosis, gene mutations, or other criteria to uncover patterns across the dataset.
I designed the full cohort-building experience: from initial concept sketches through UX flows, menu systems, and final UI components for comparison views across expression, histology, and variants.
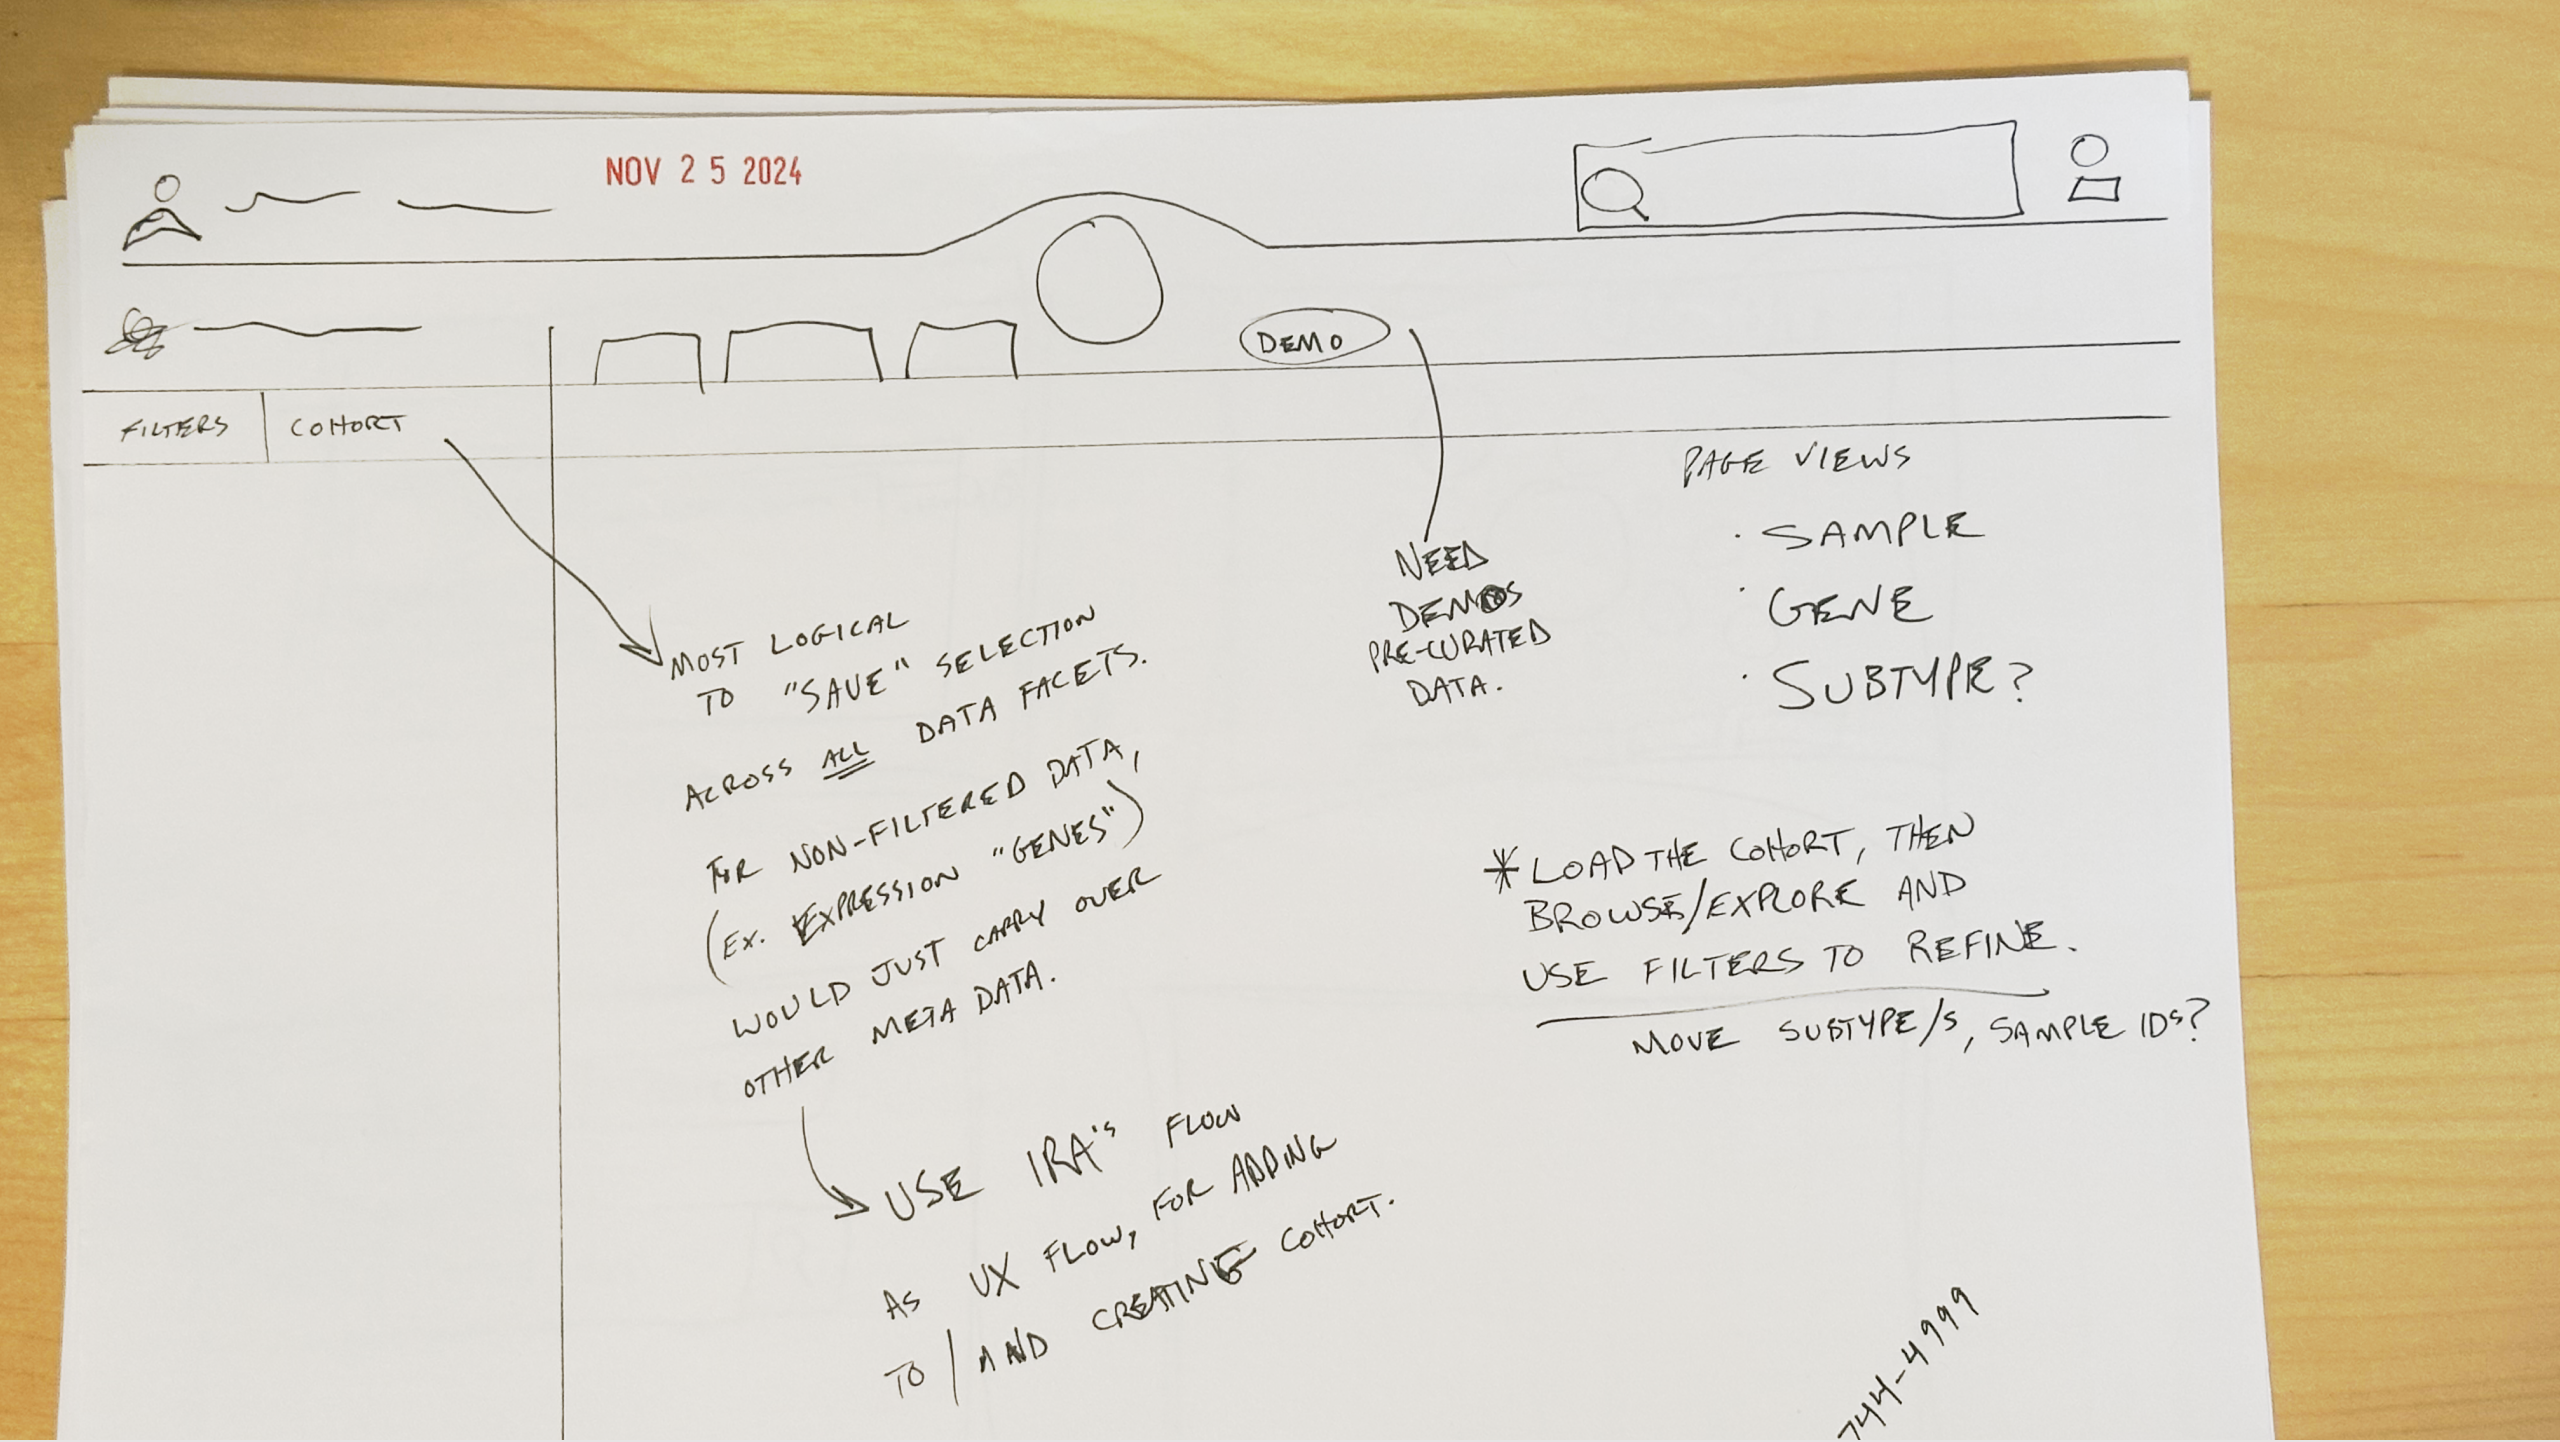 Early cohort building concept sketches
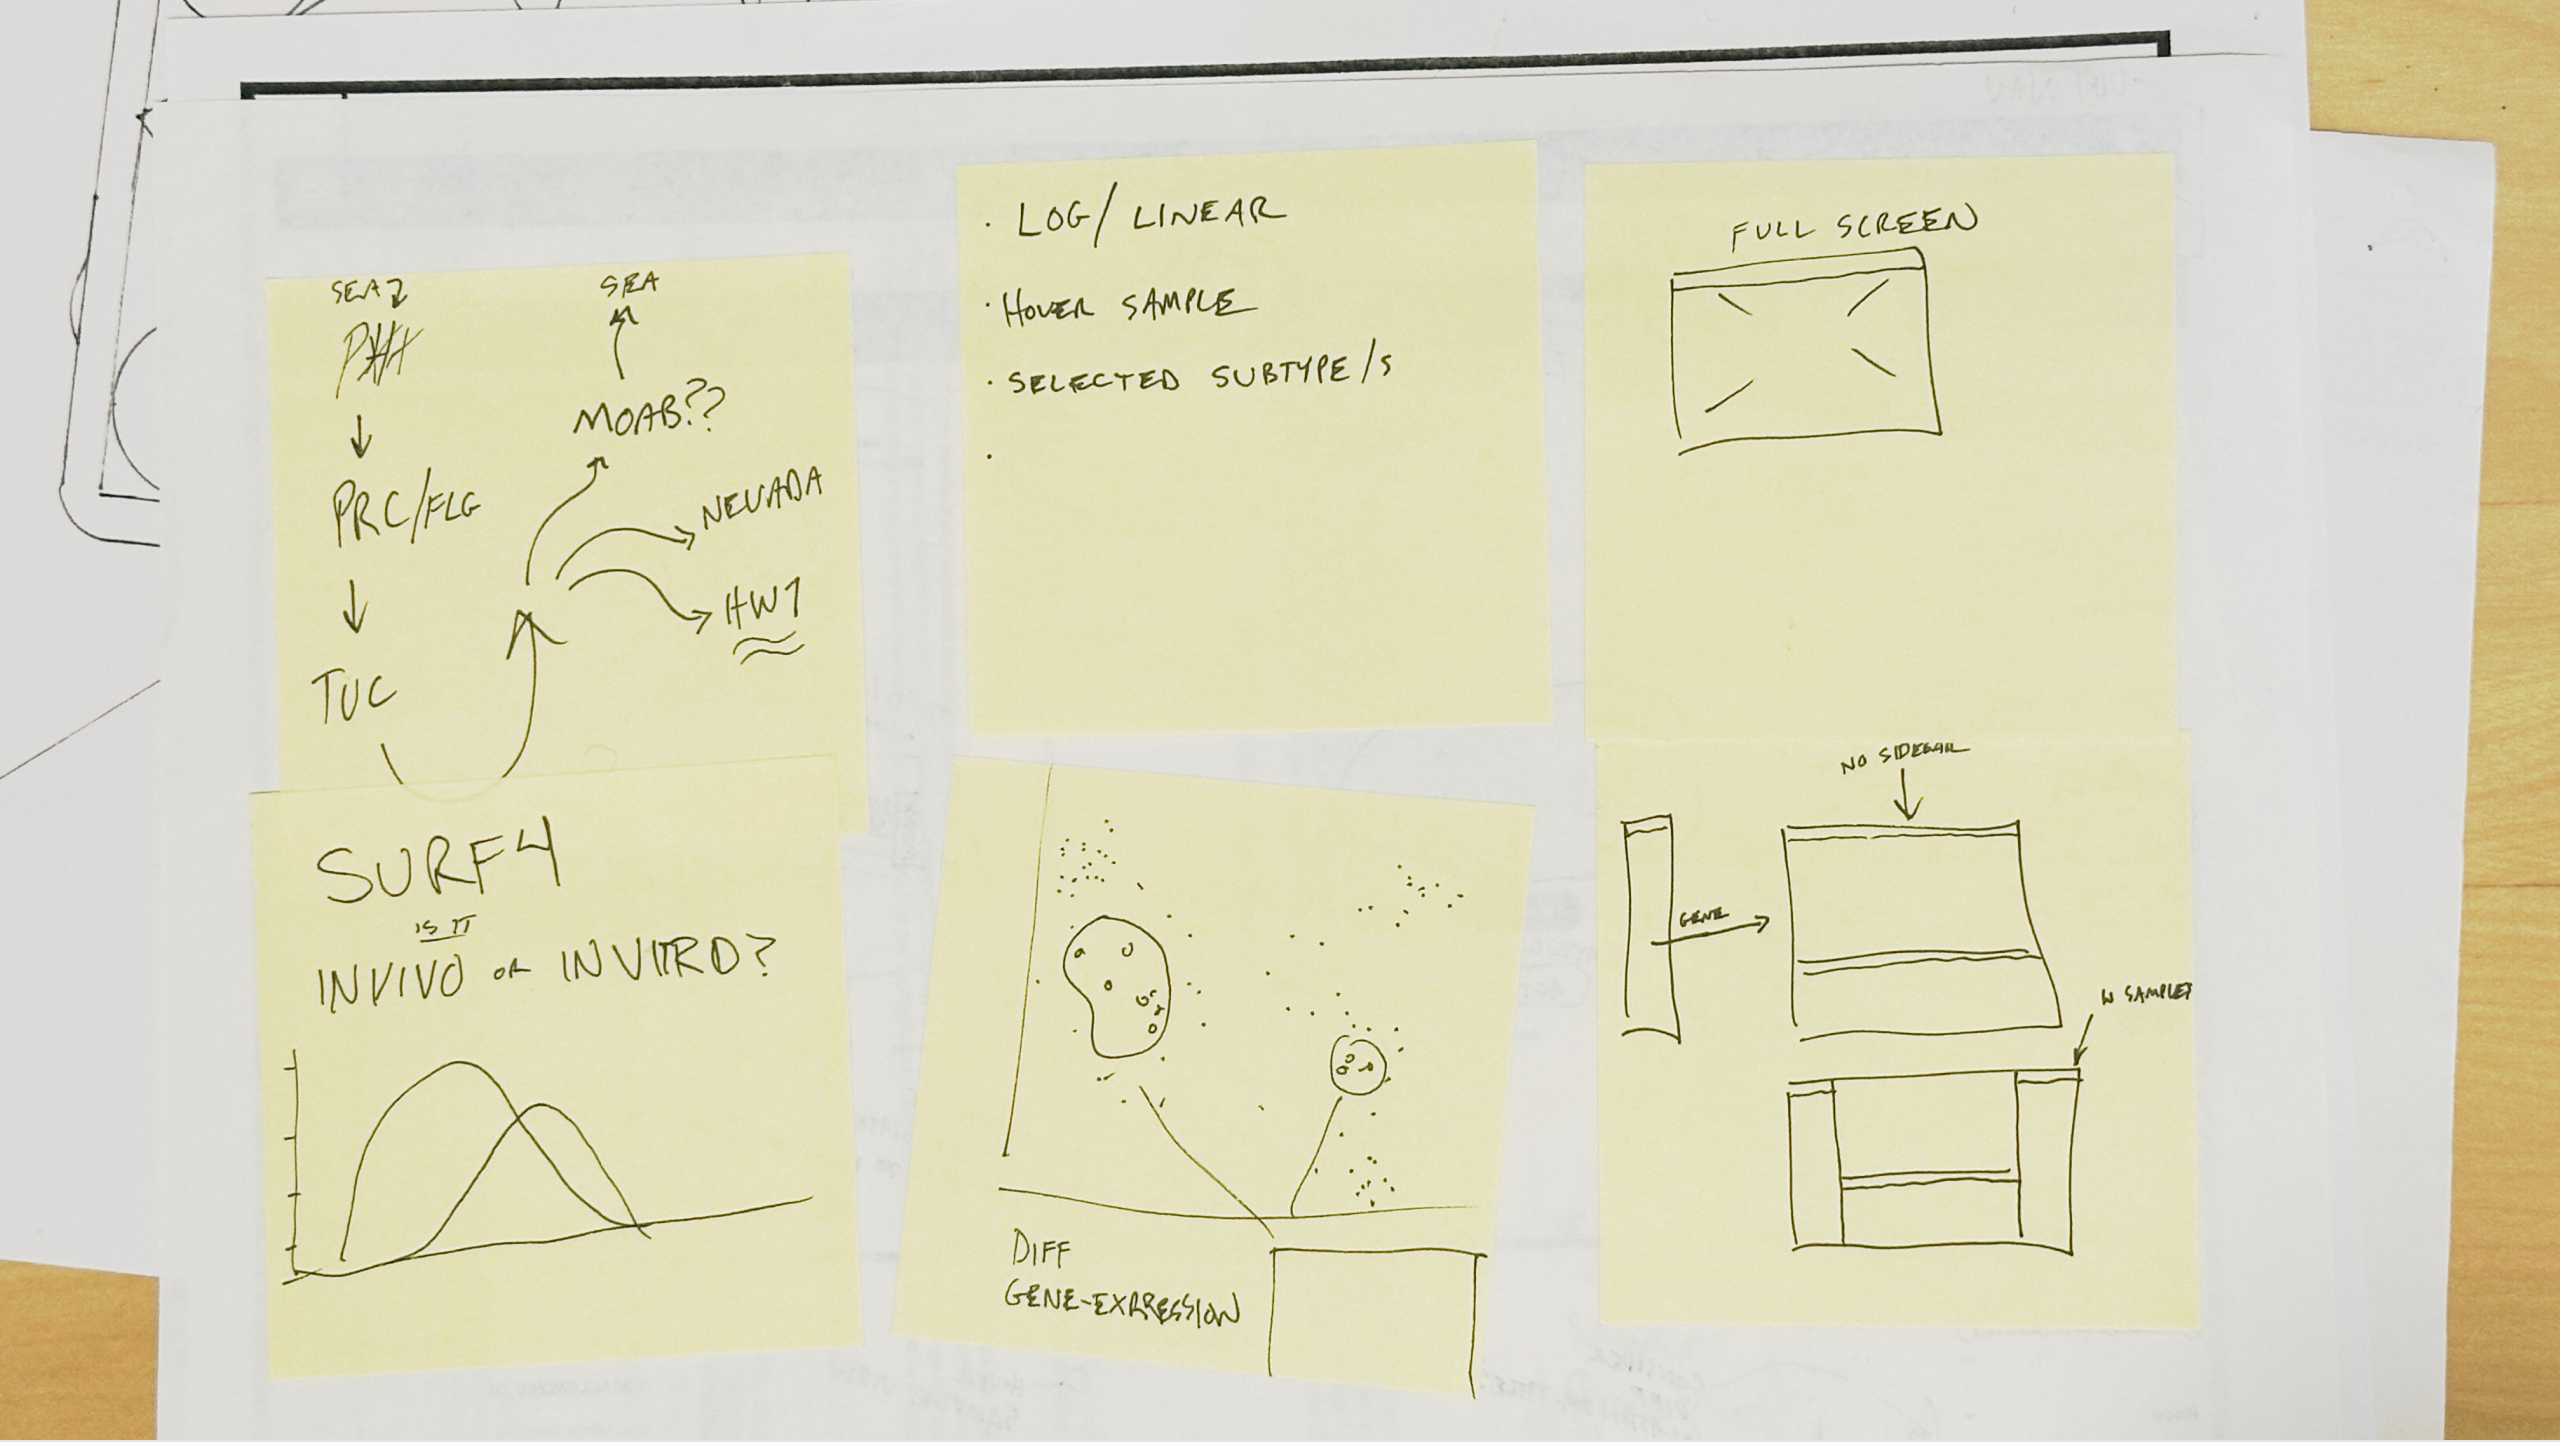 Gene cohort exploration sketches
 Cohort interaction mockup showing multi-cohort comparison flow
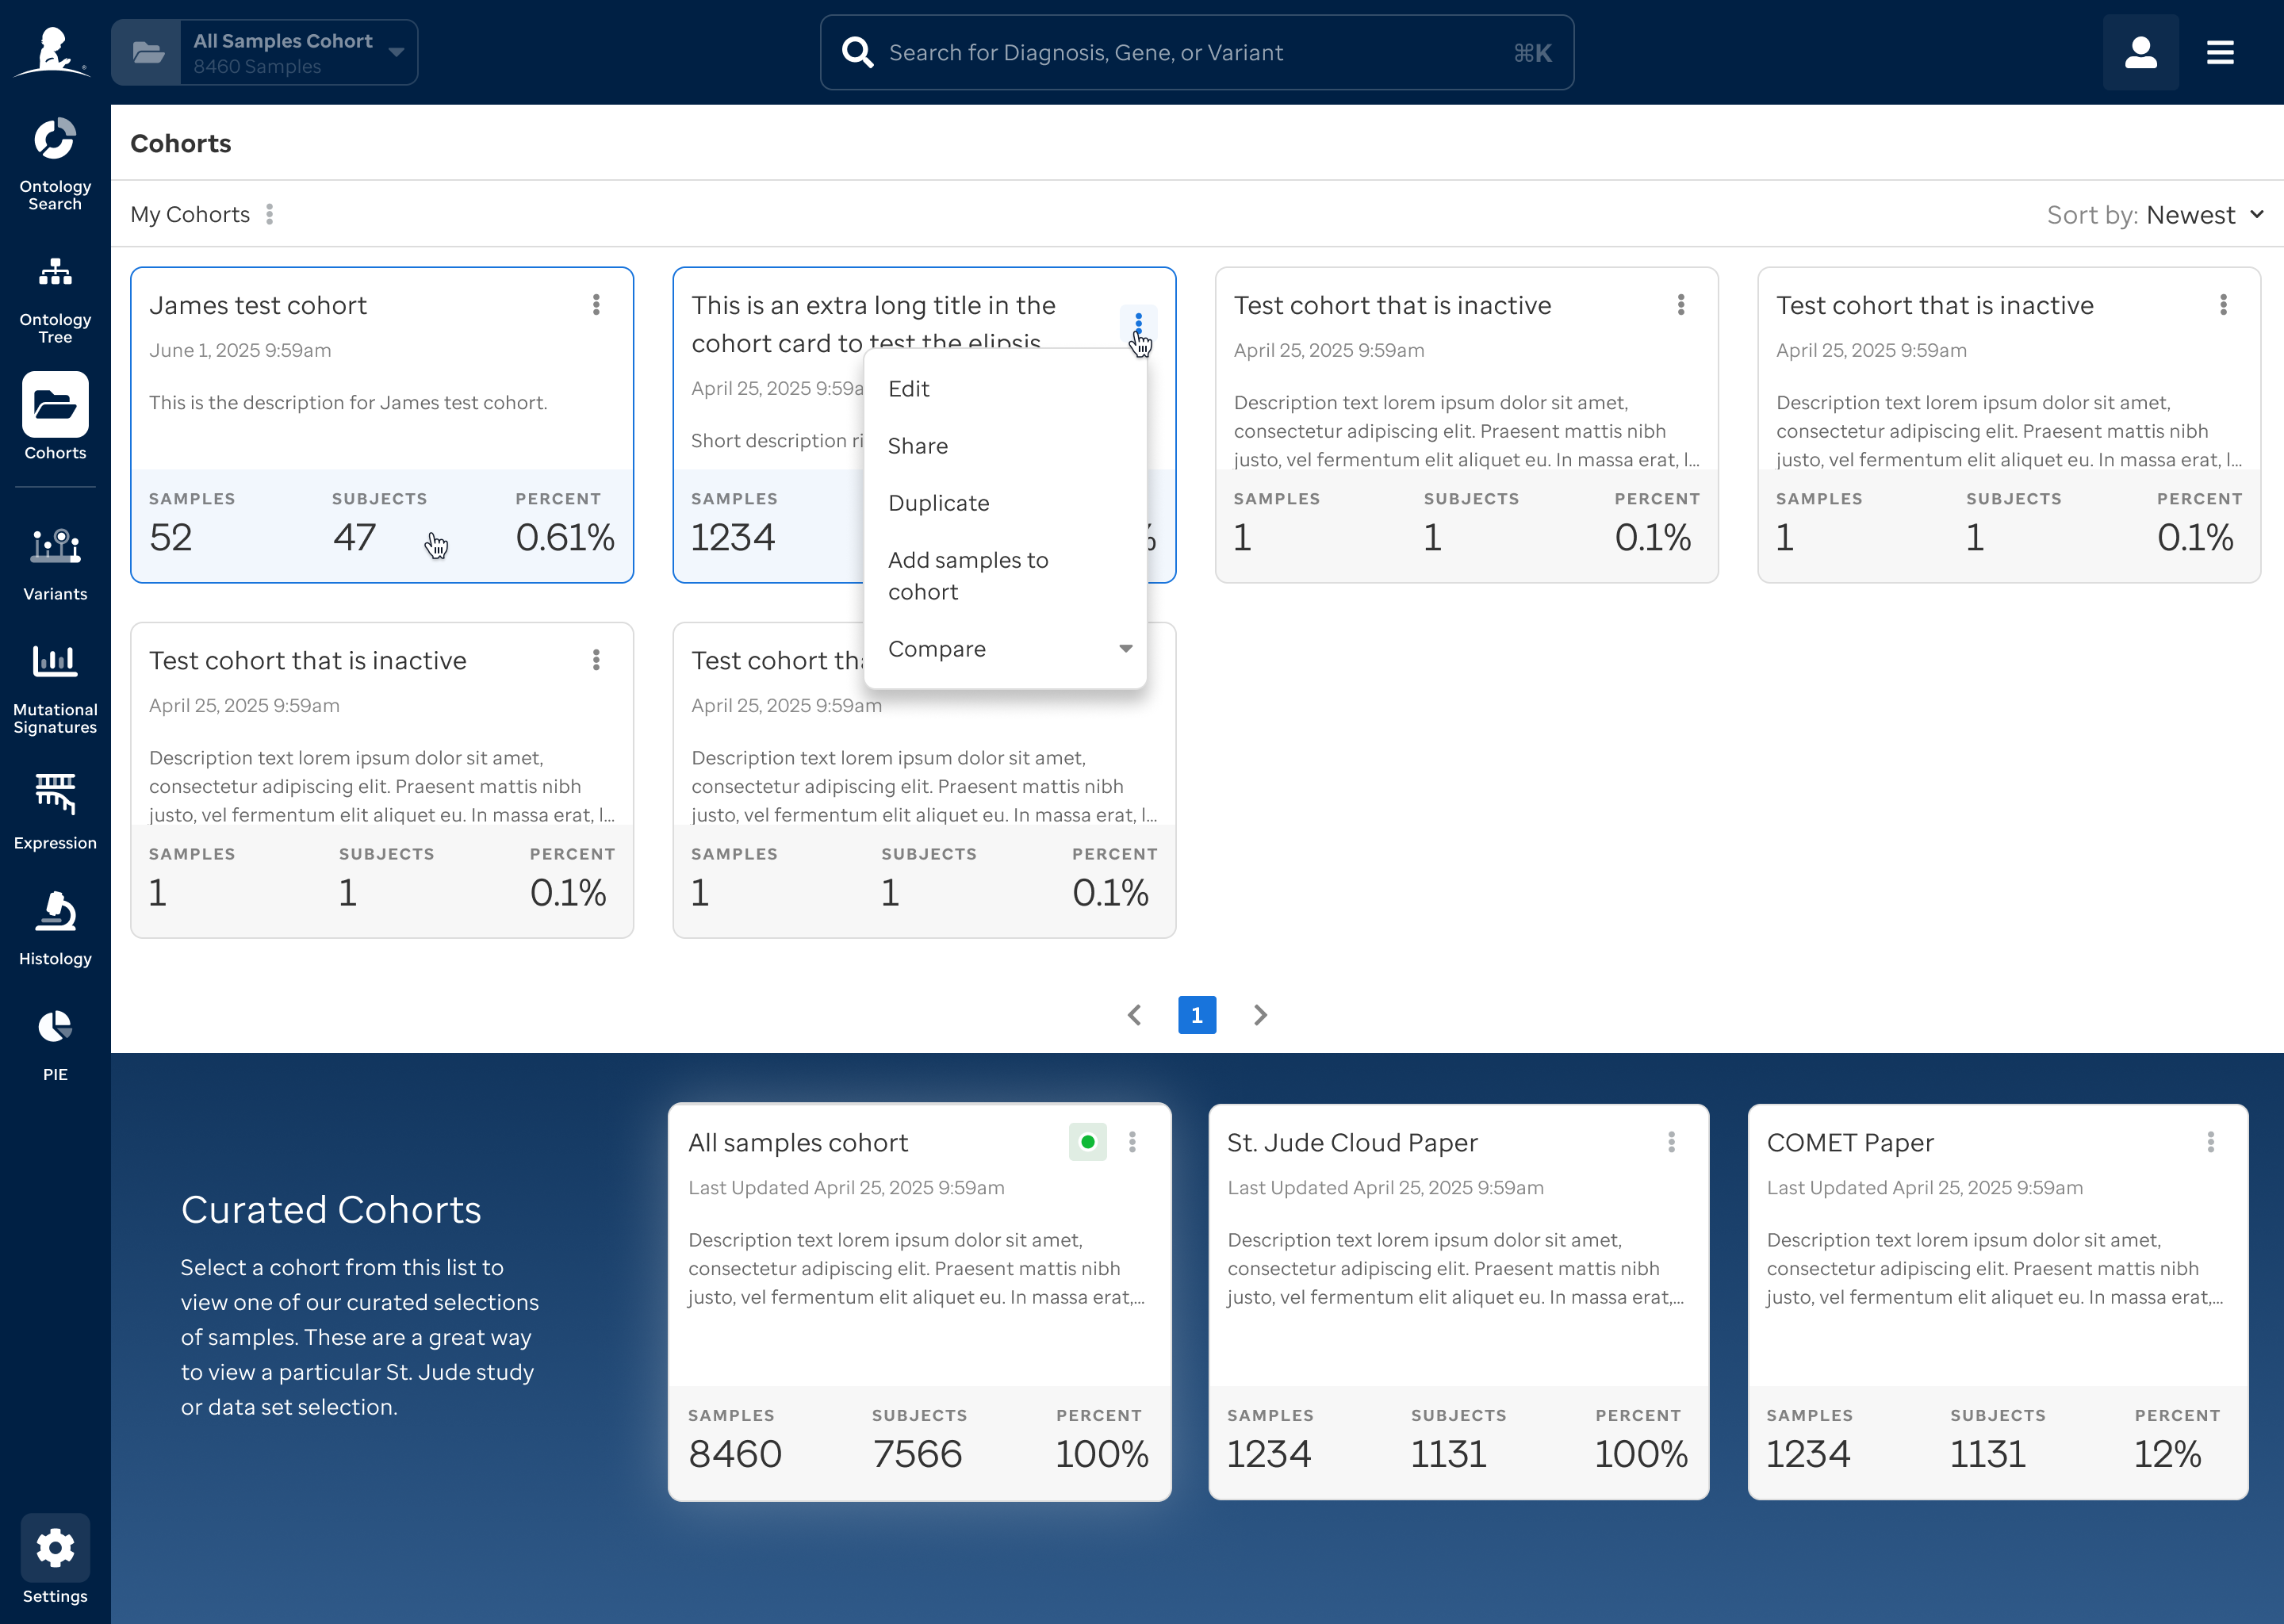
 My Cohorts grid view
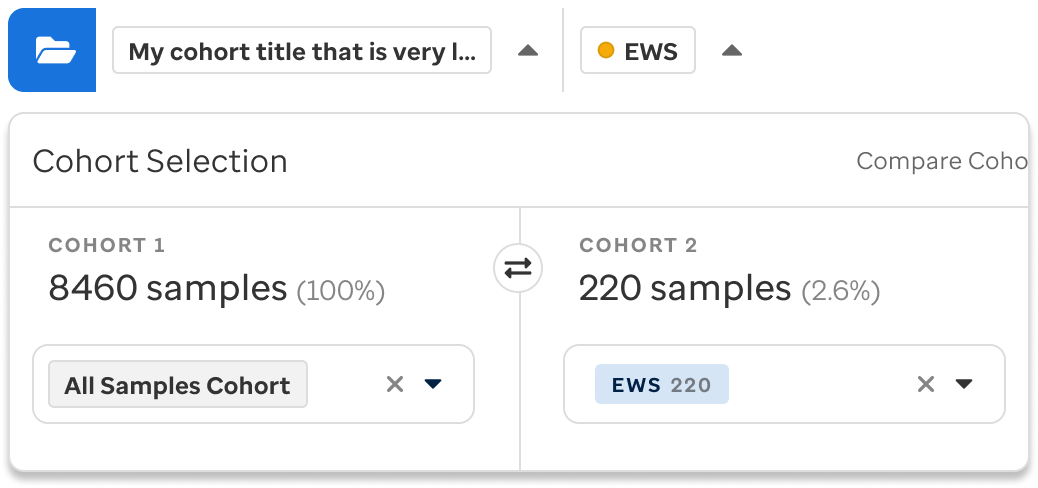 Cohort compare dropdown
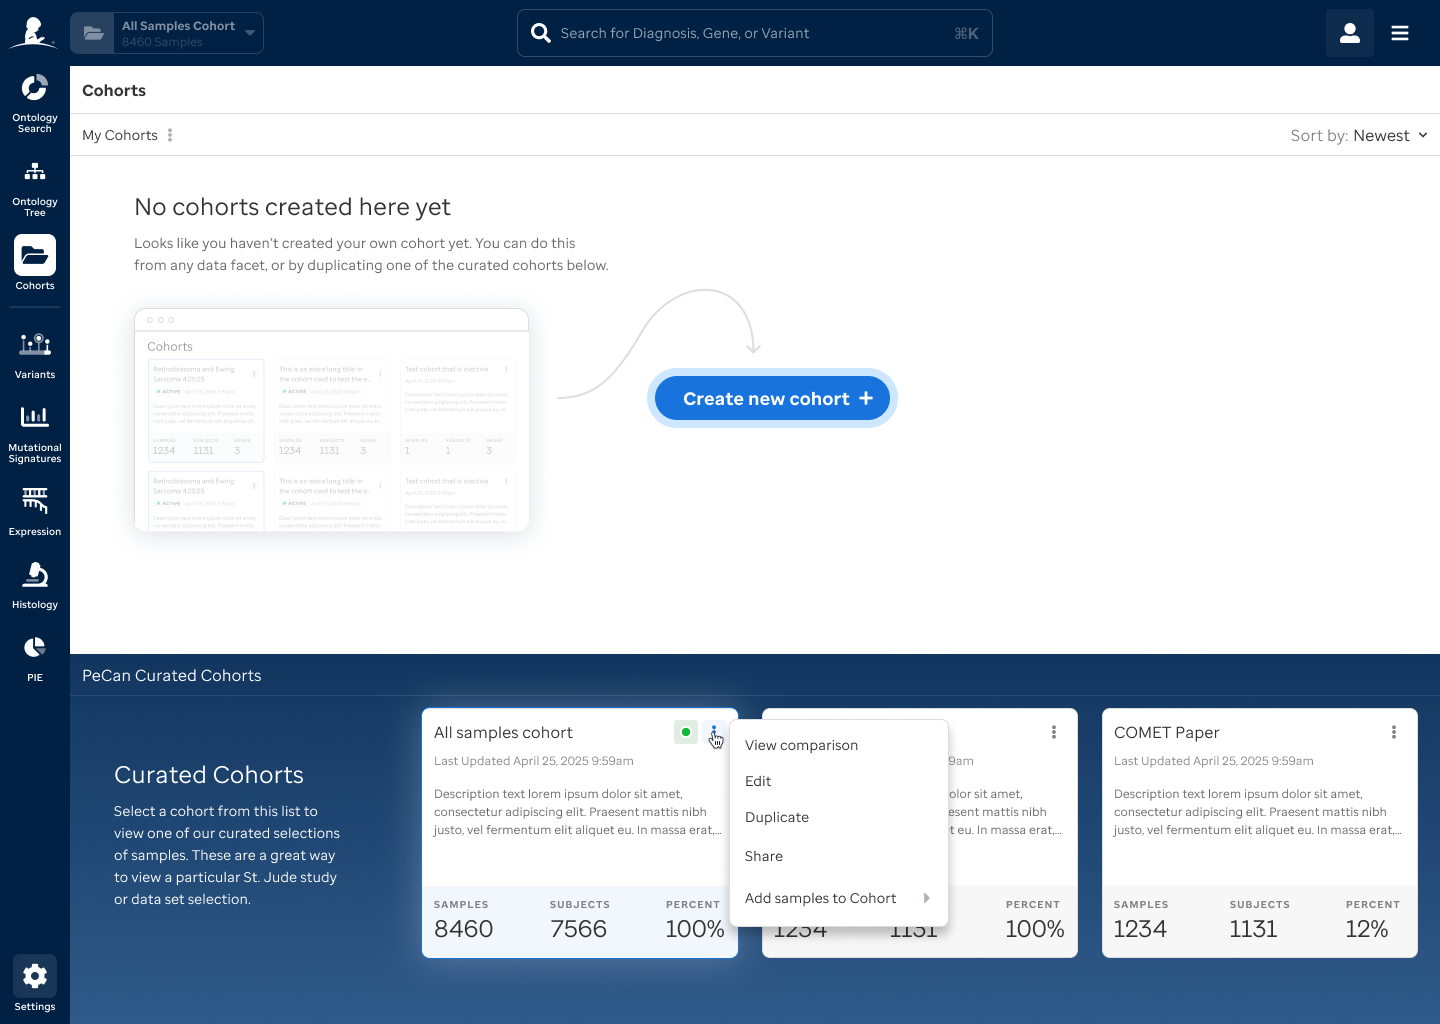
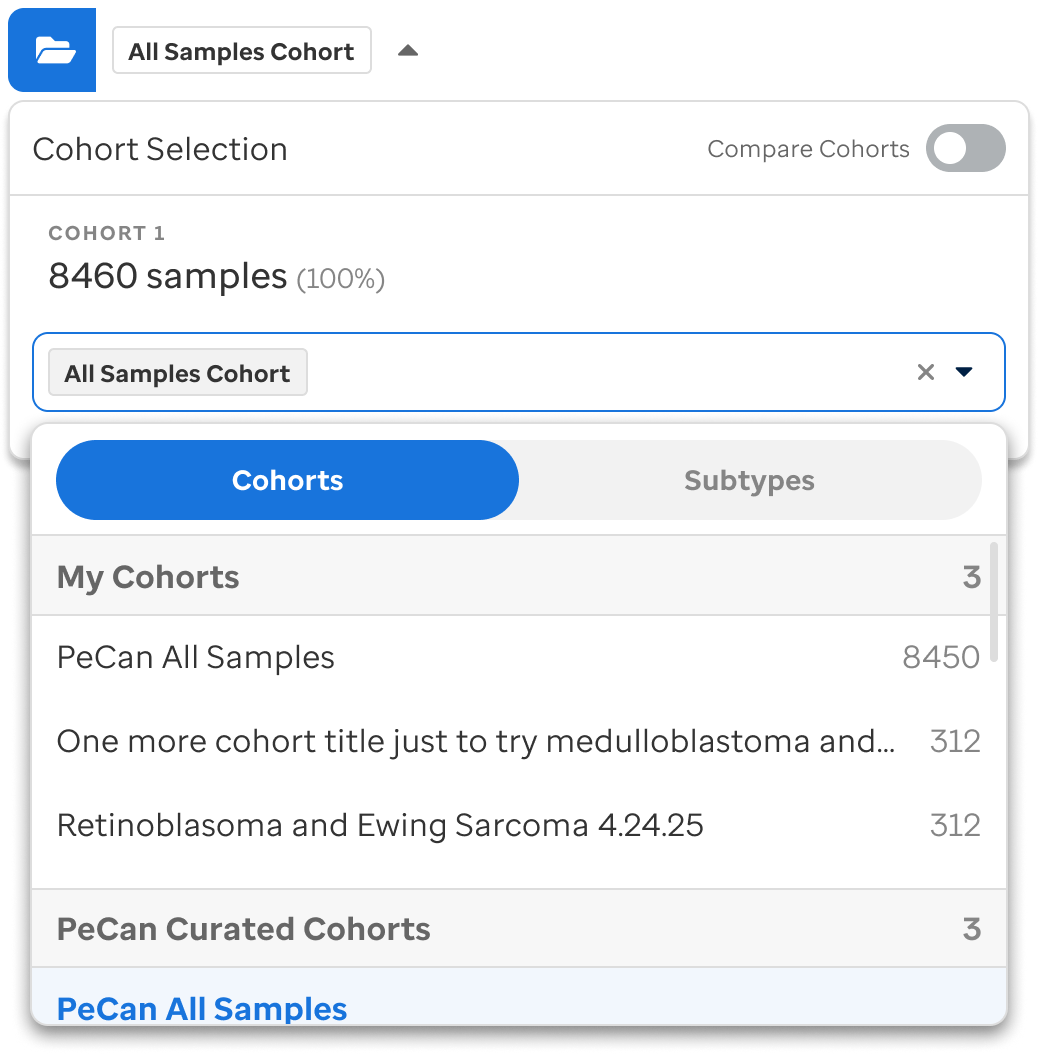 Cohort selection dropdown menu
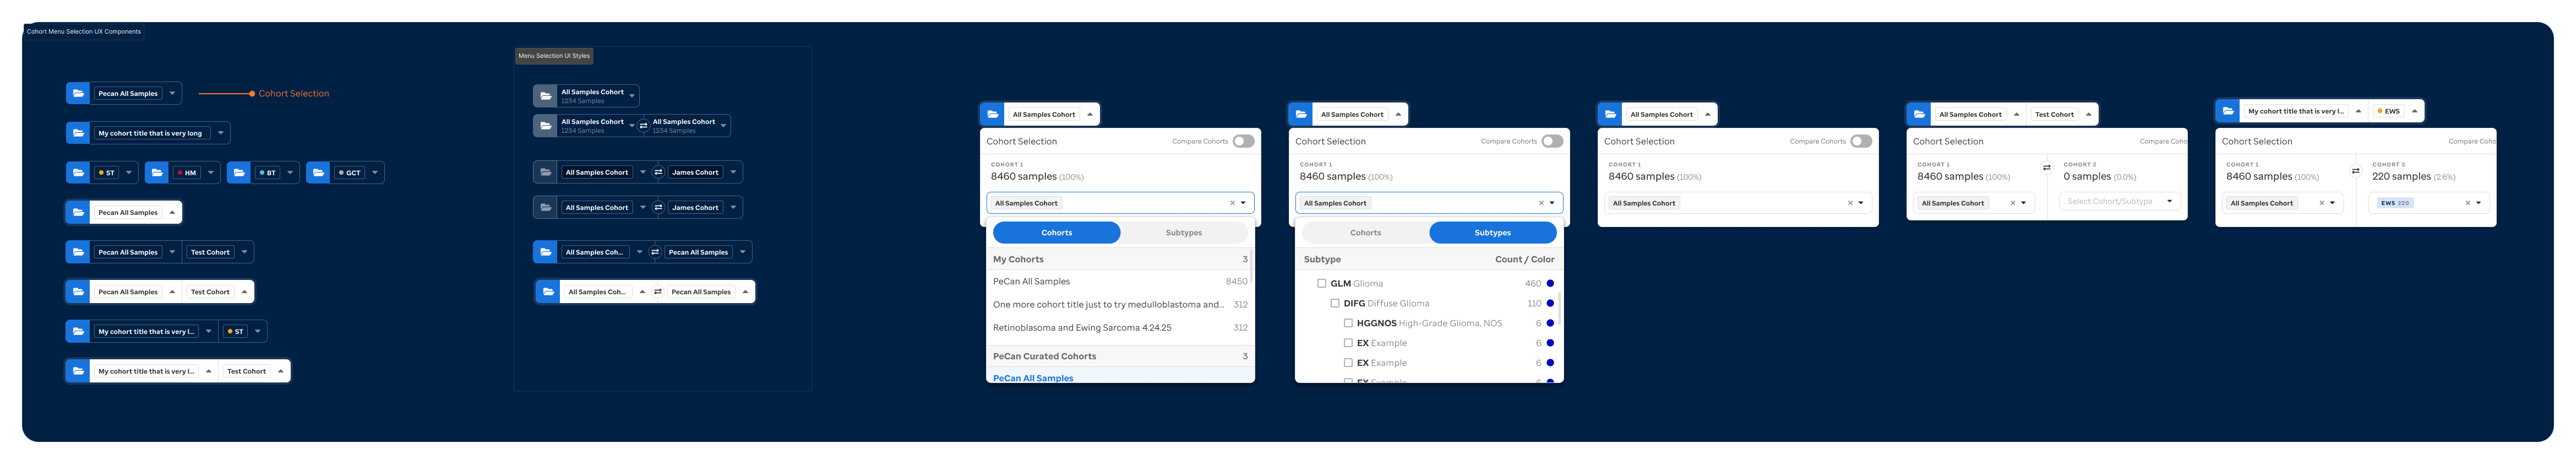 Cohort menu selection UX components
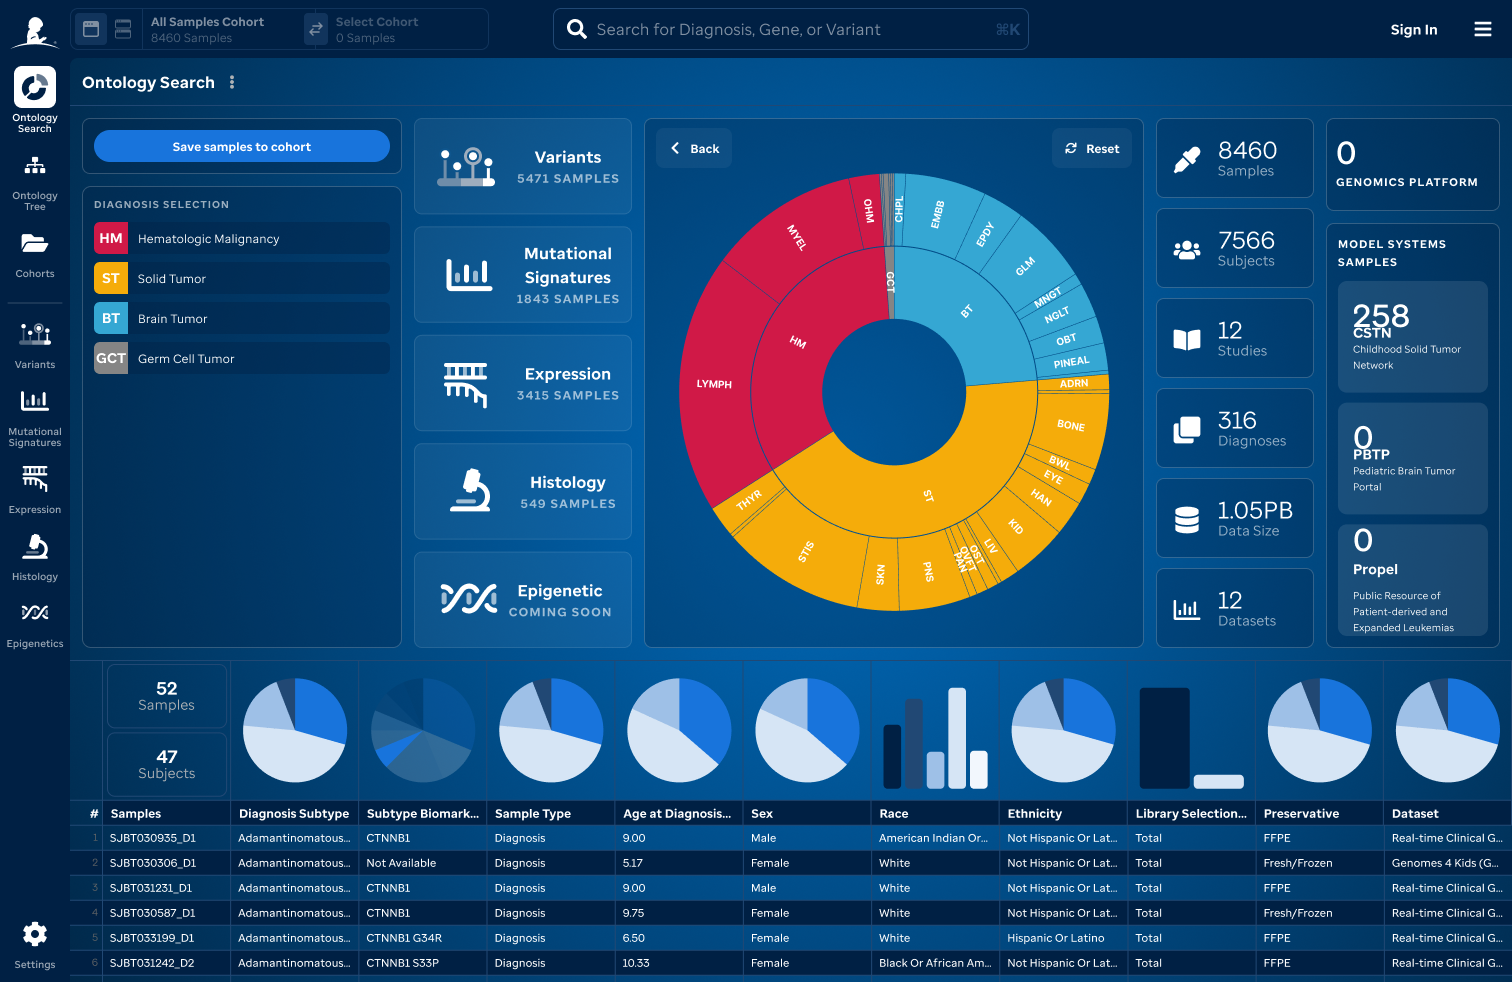 Ontology search — sunburst visualization
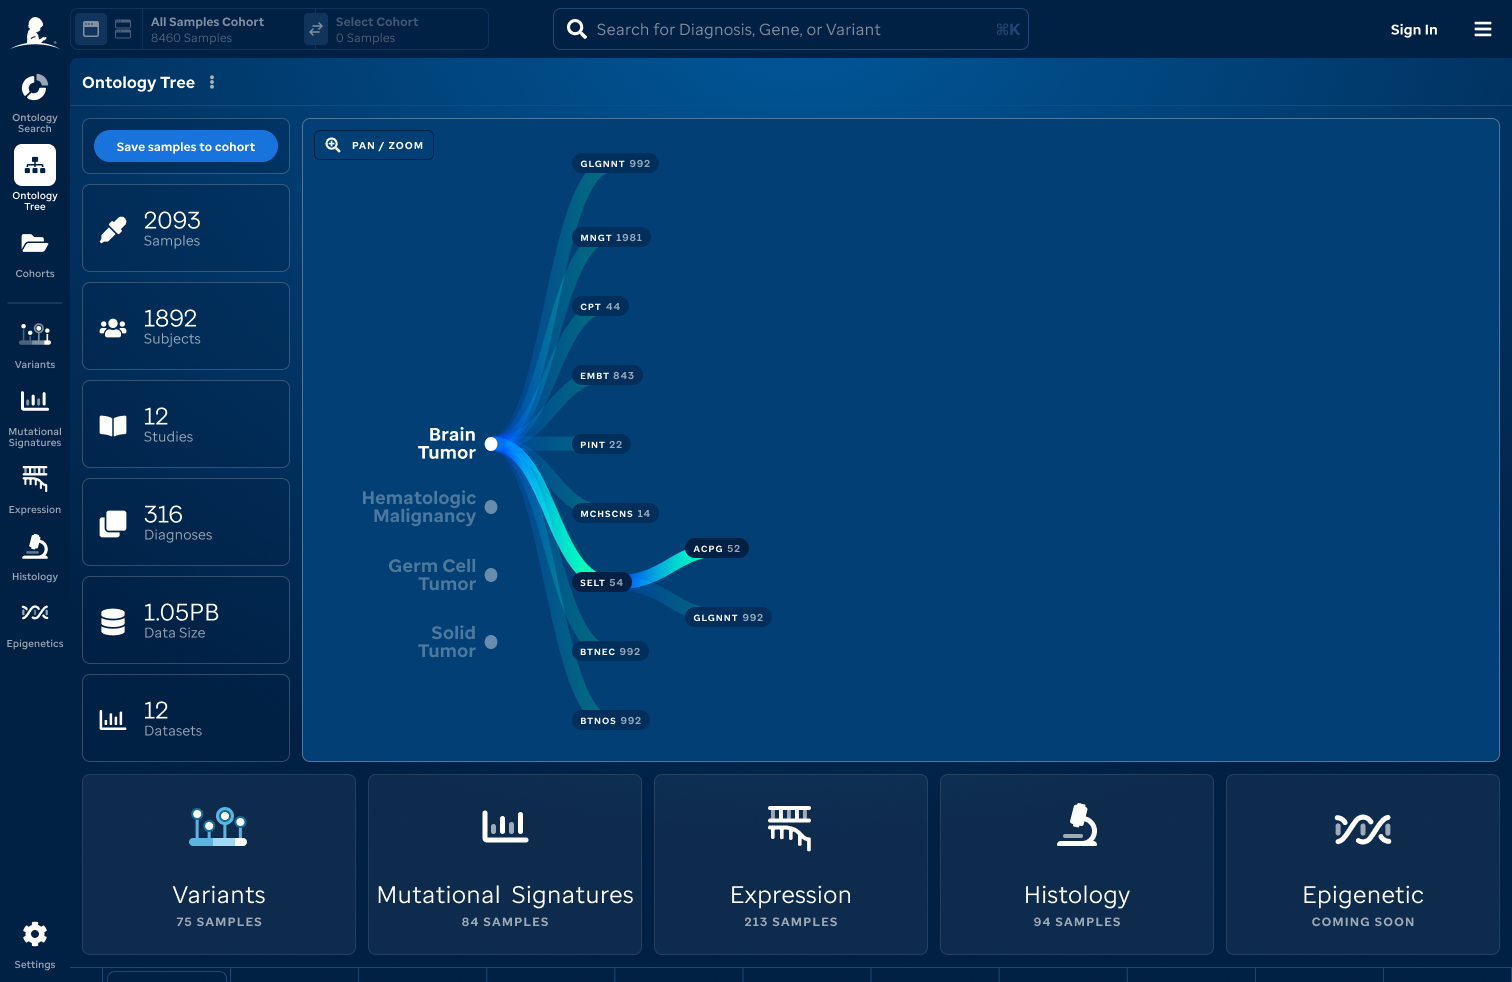 Ontology tree navigation
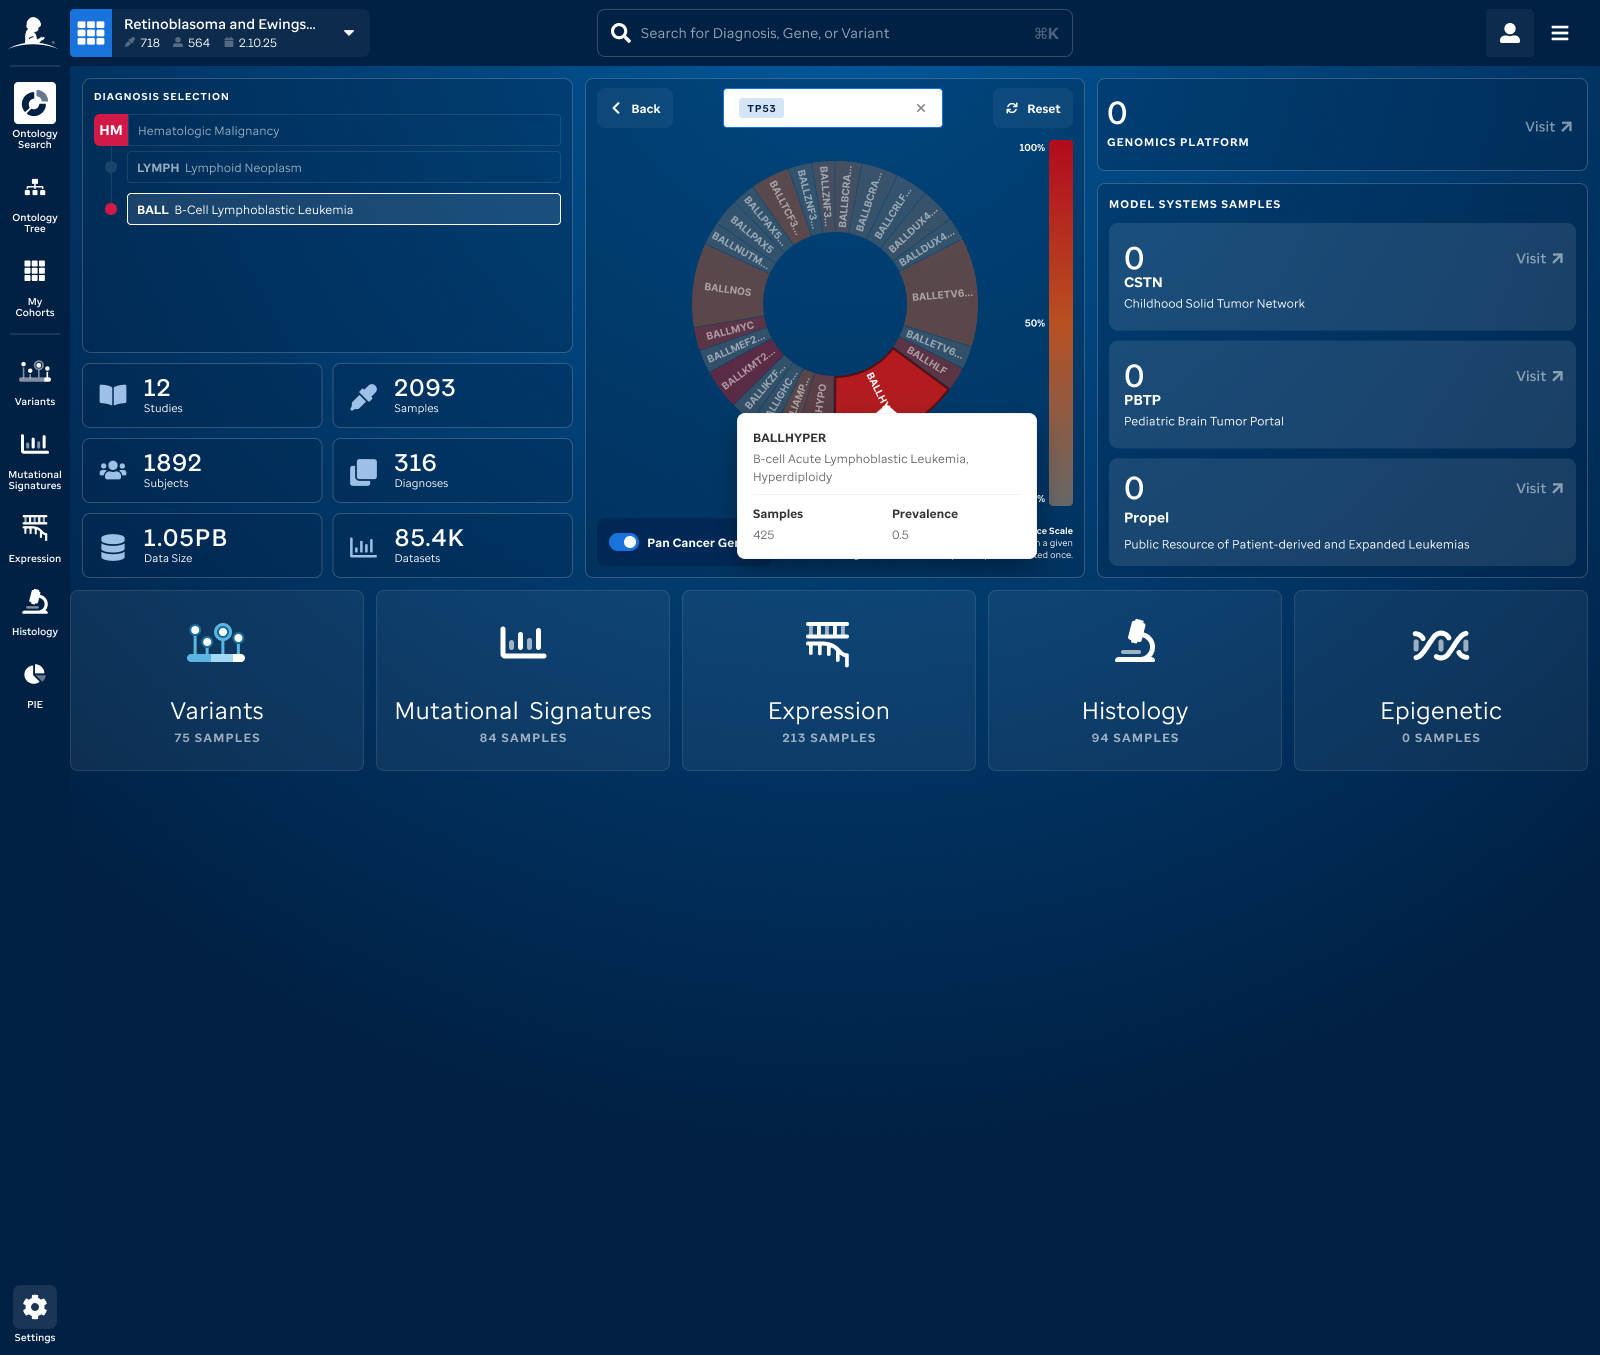 PeCan disease sunburst
 Mutational signatures view
 Cohort expression comparison
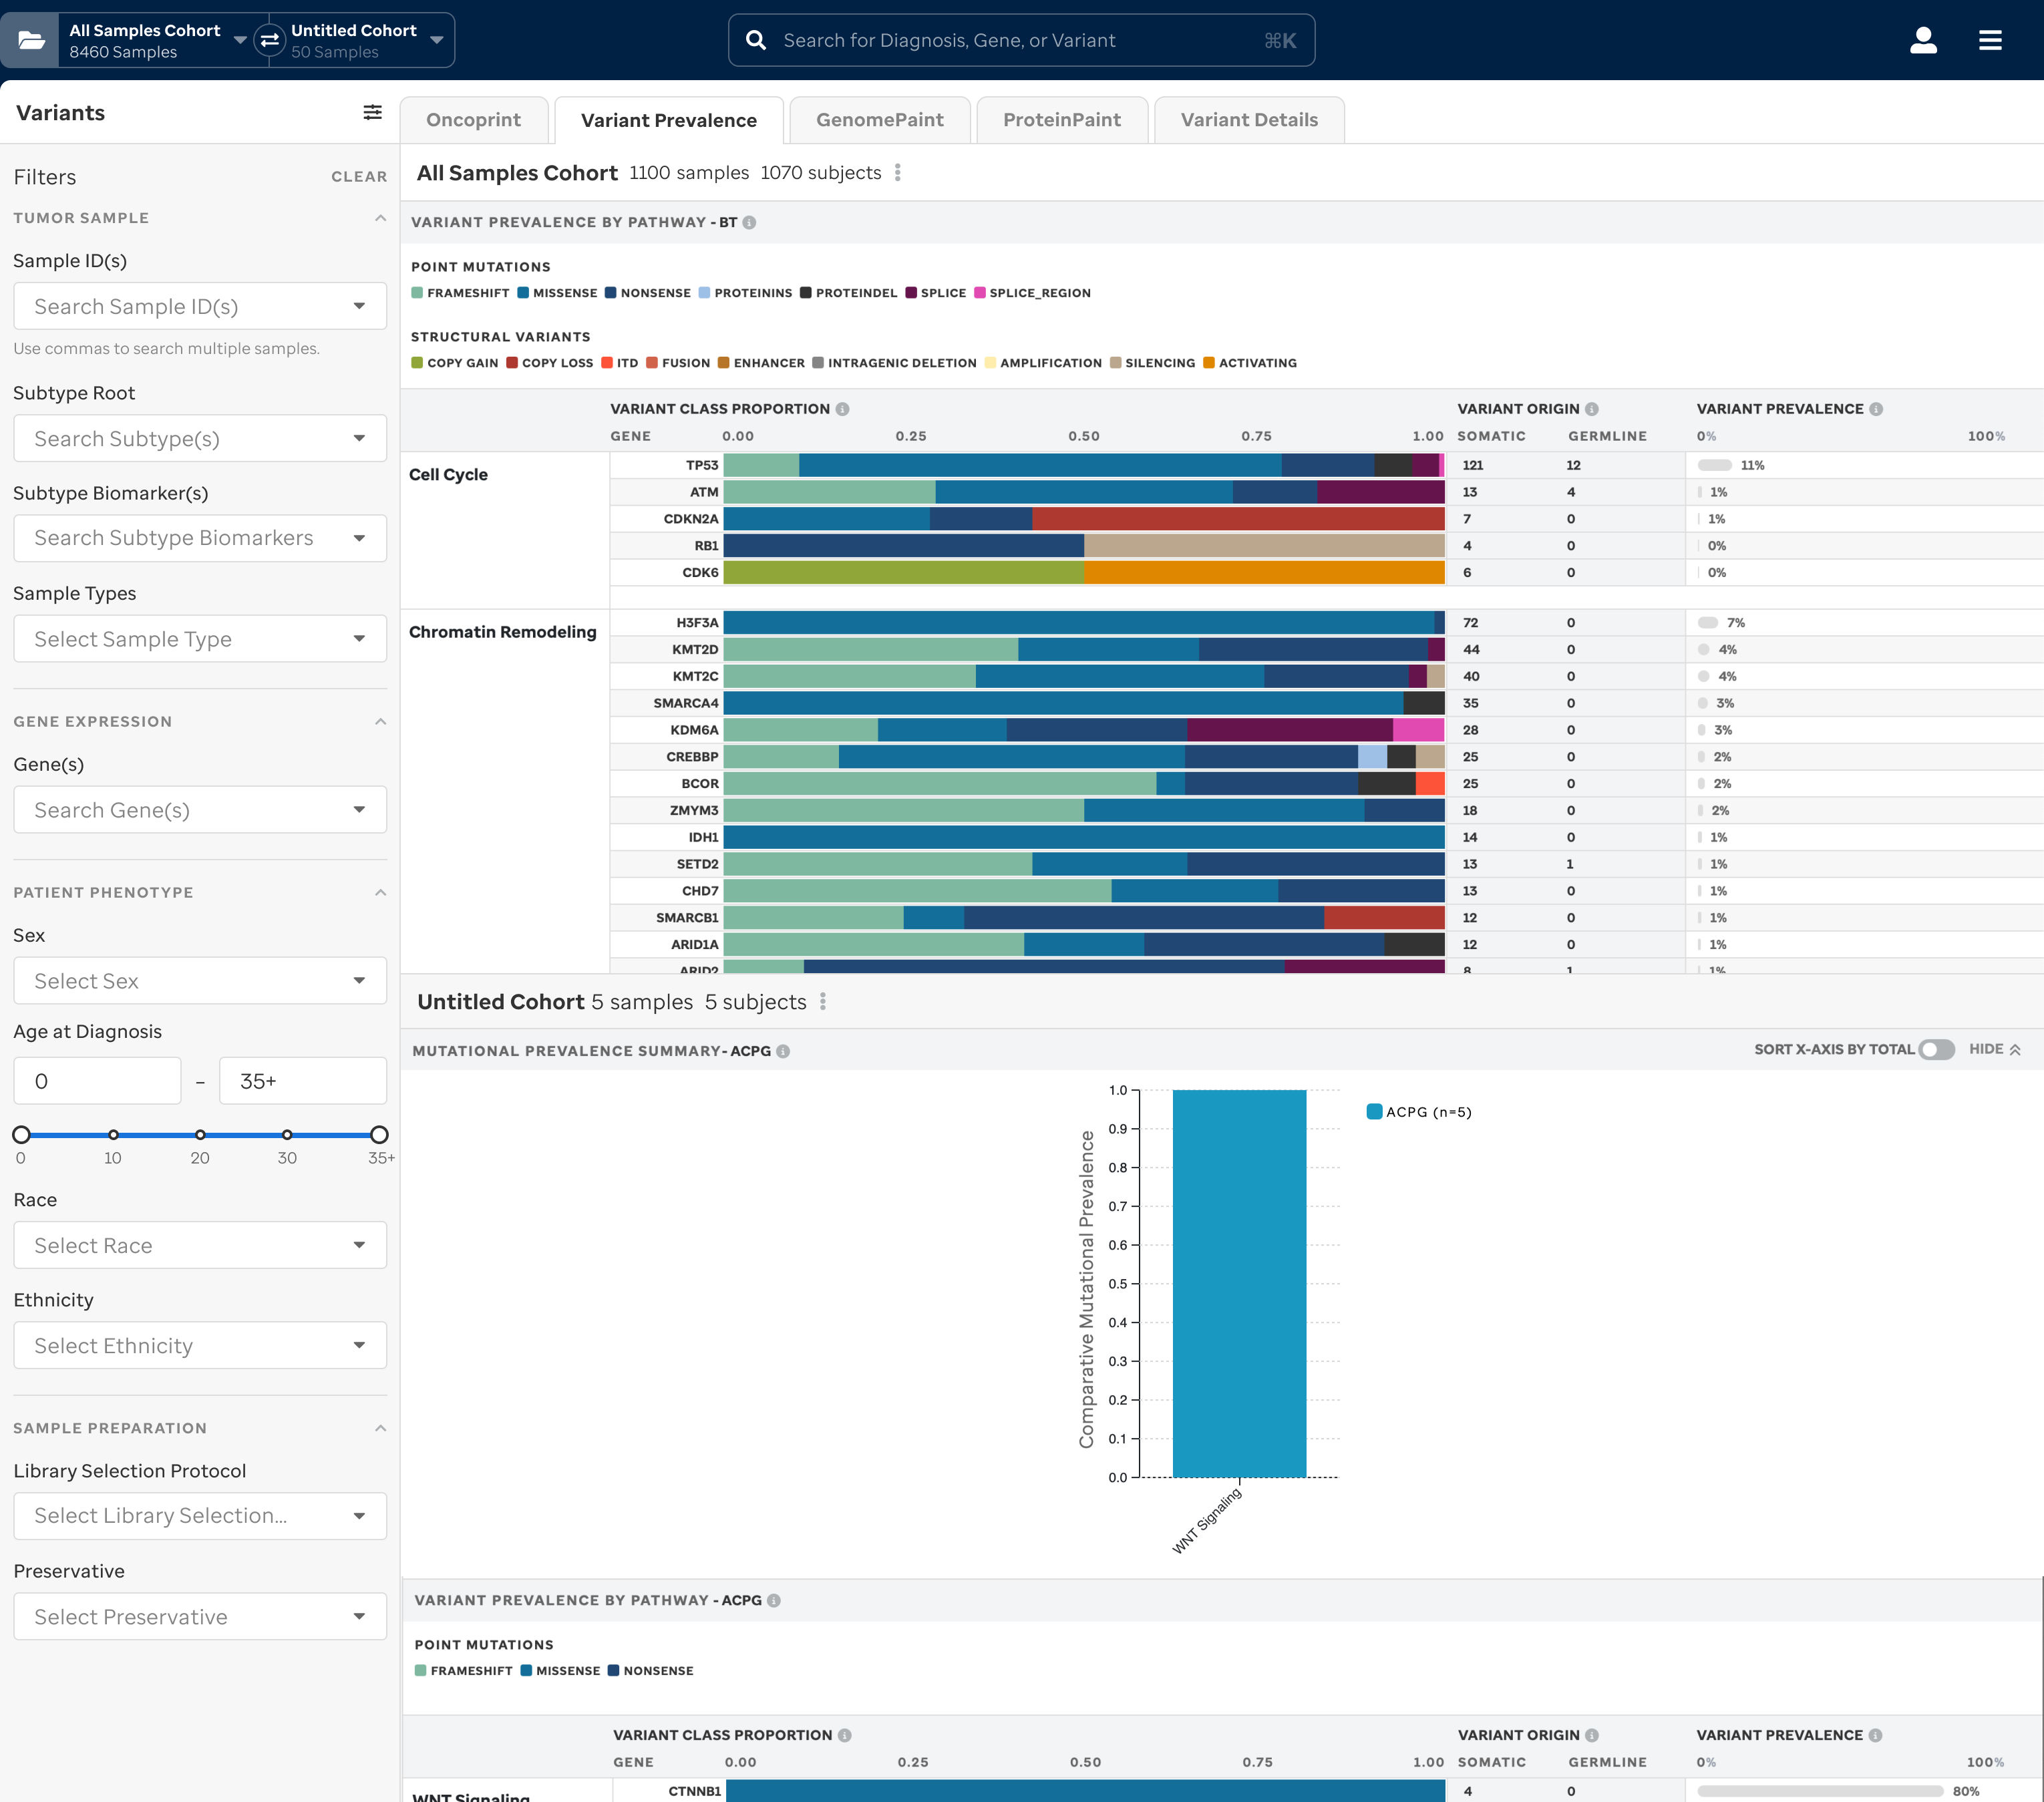 Cohort expression prevalence comparison
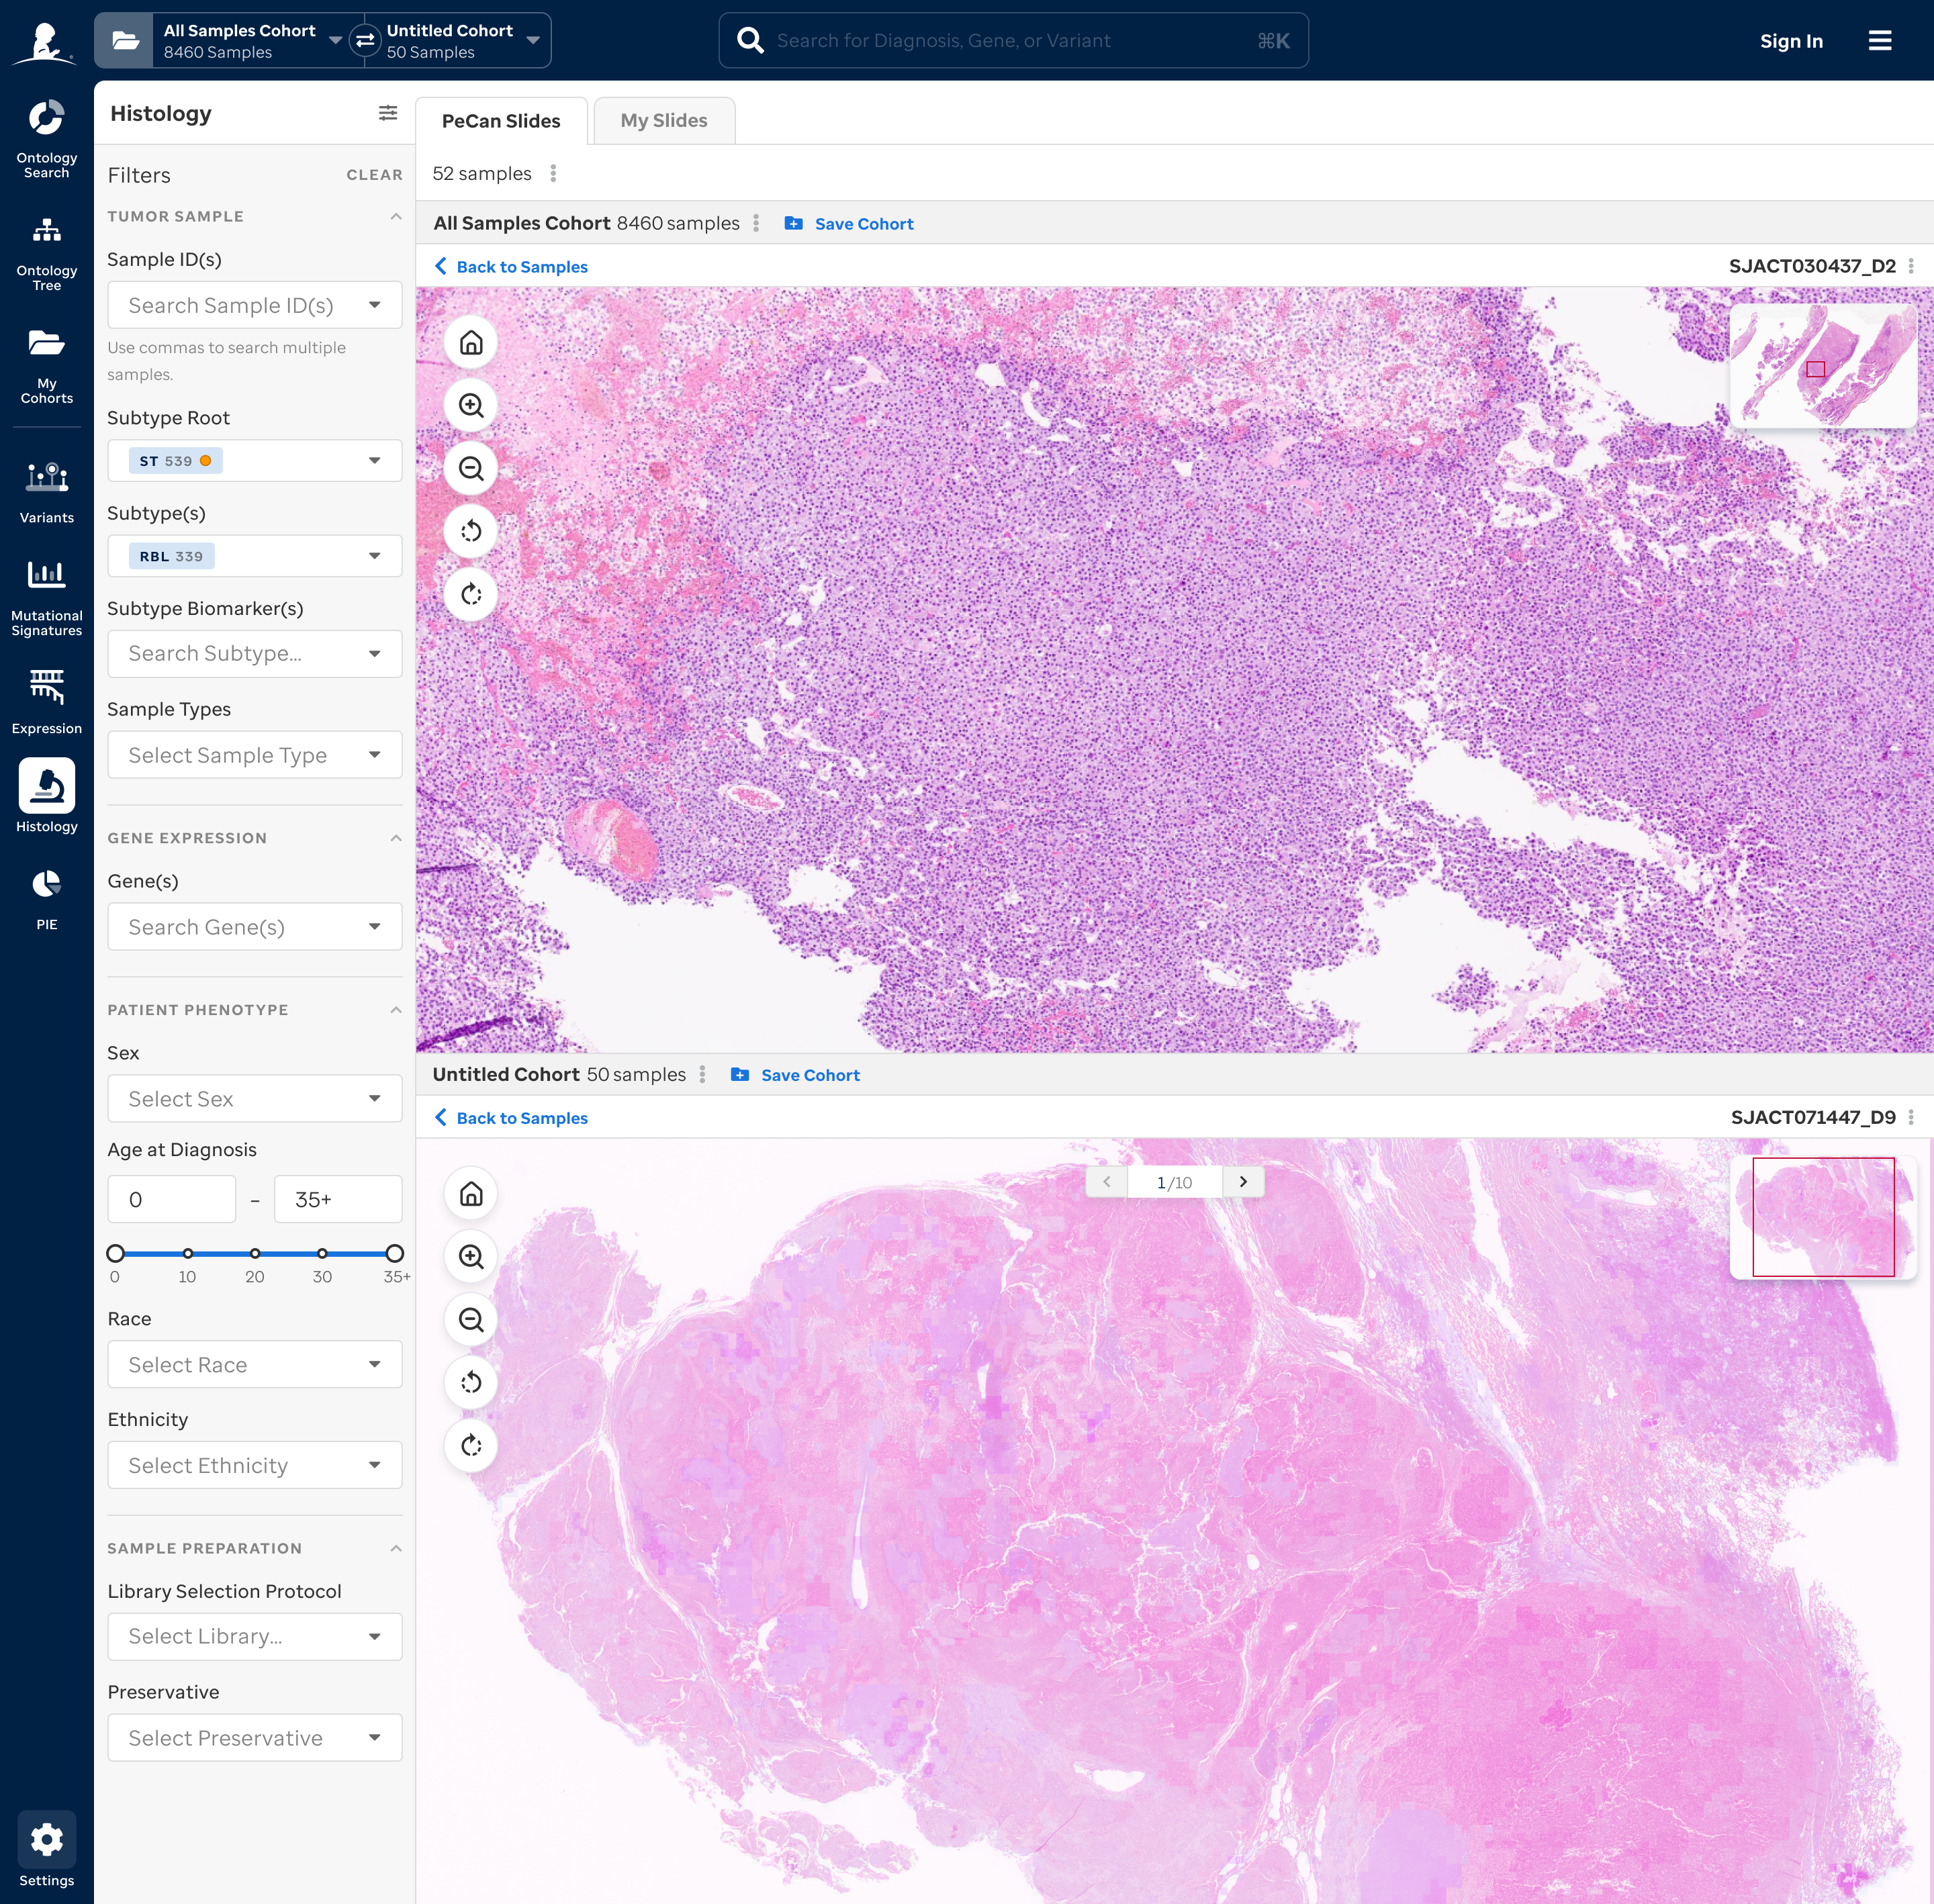 Cohort histology comparison
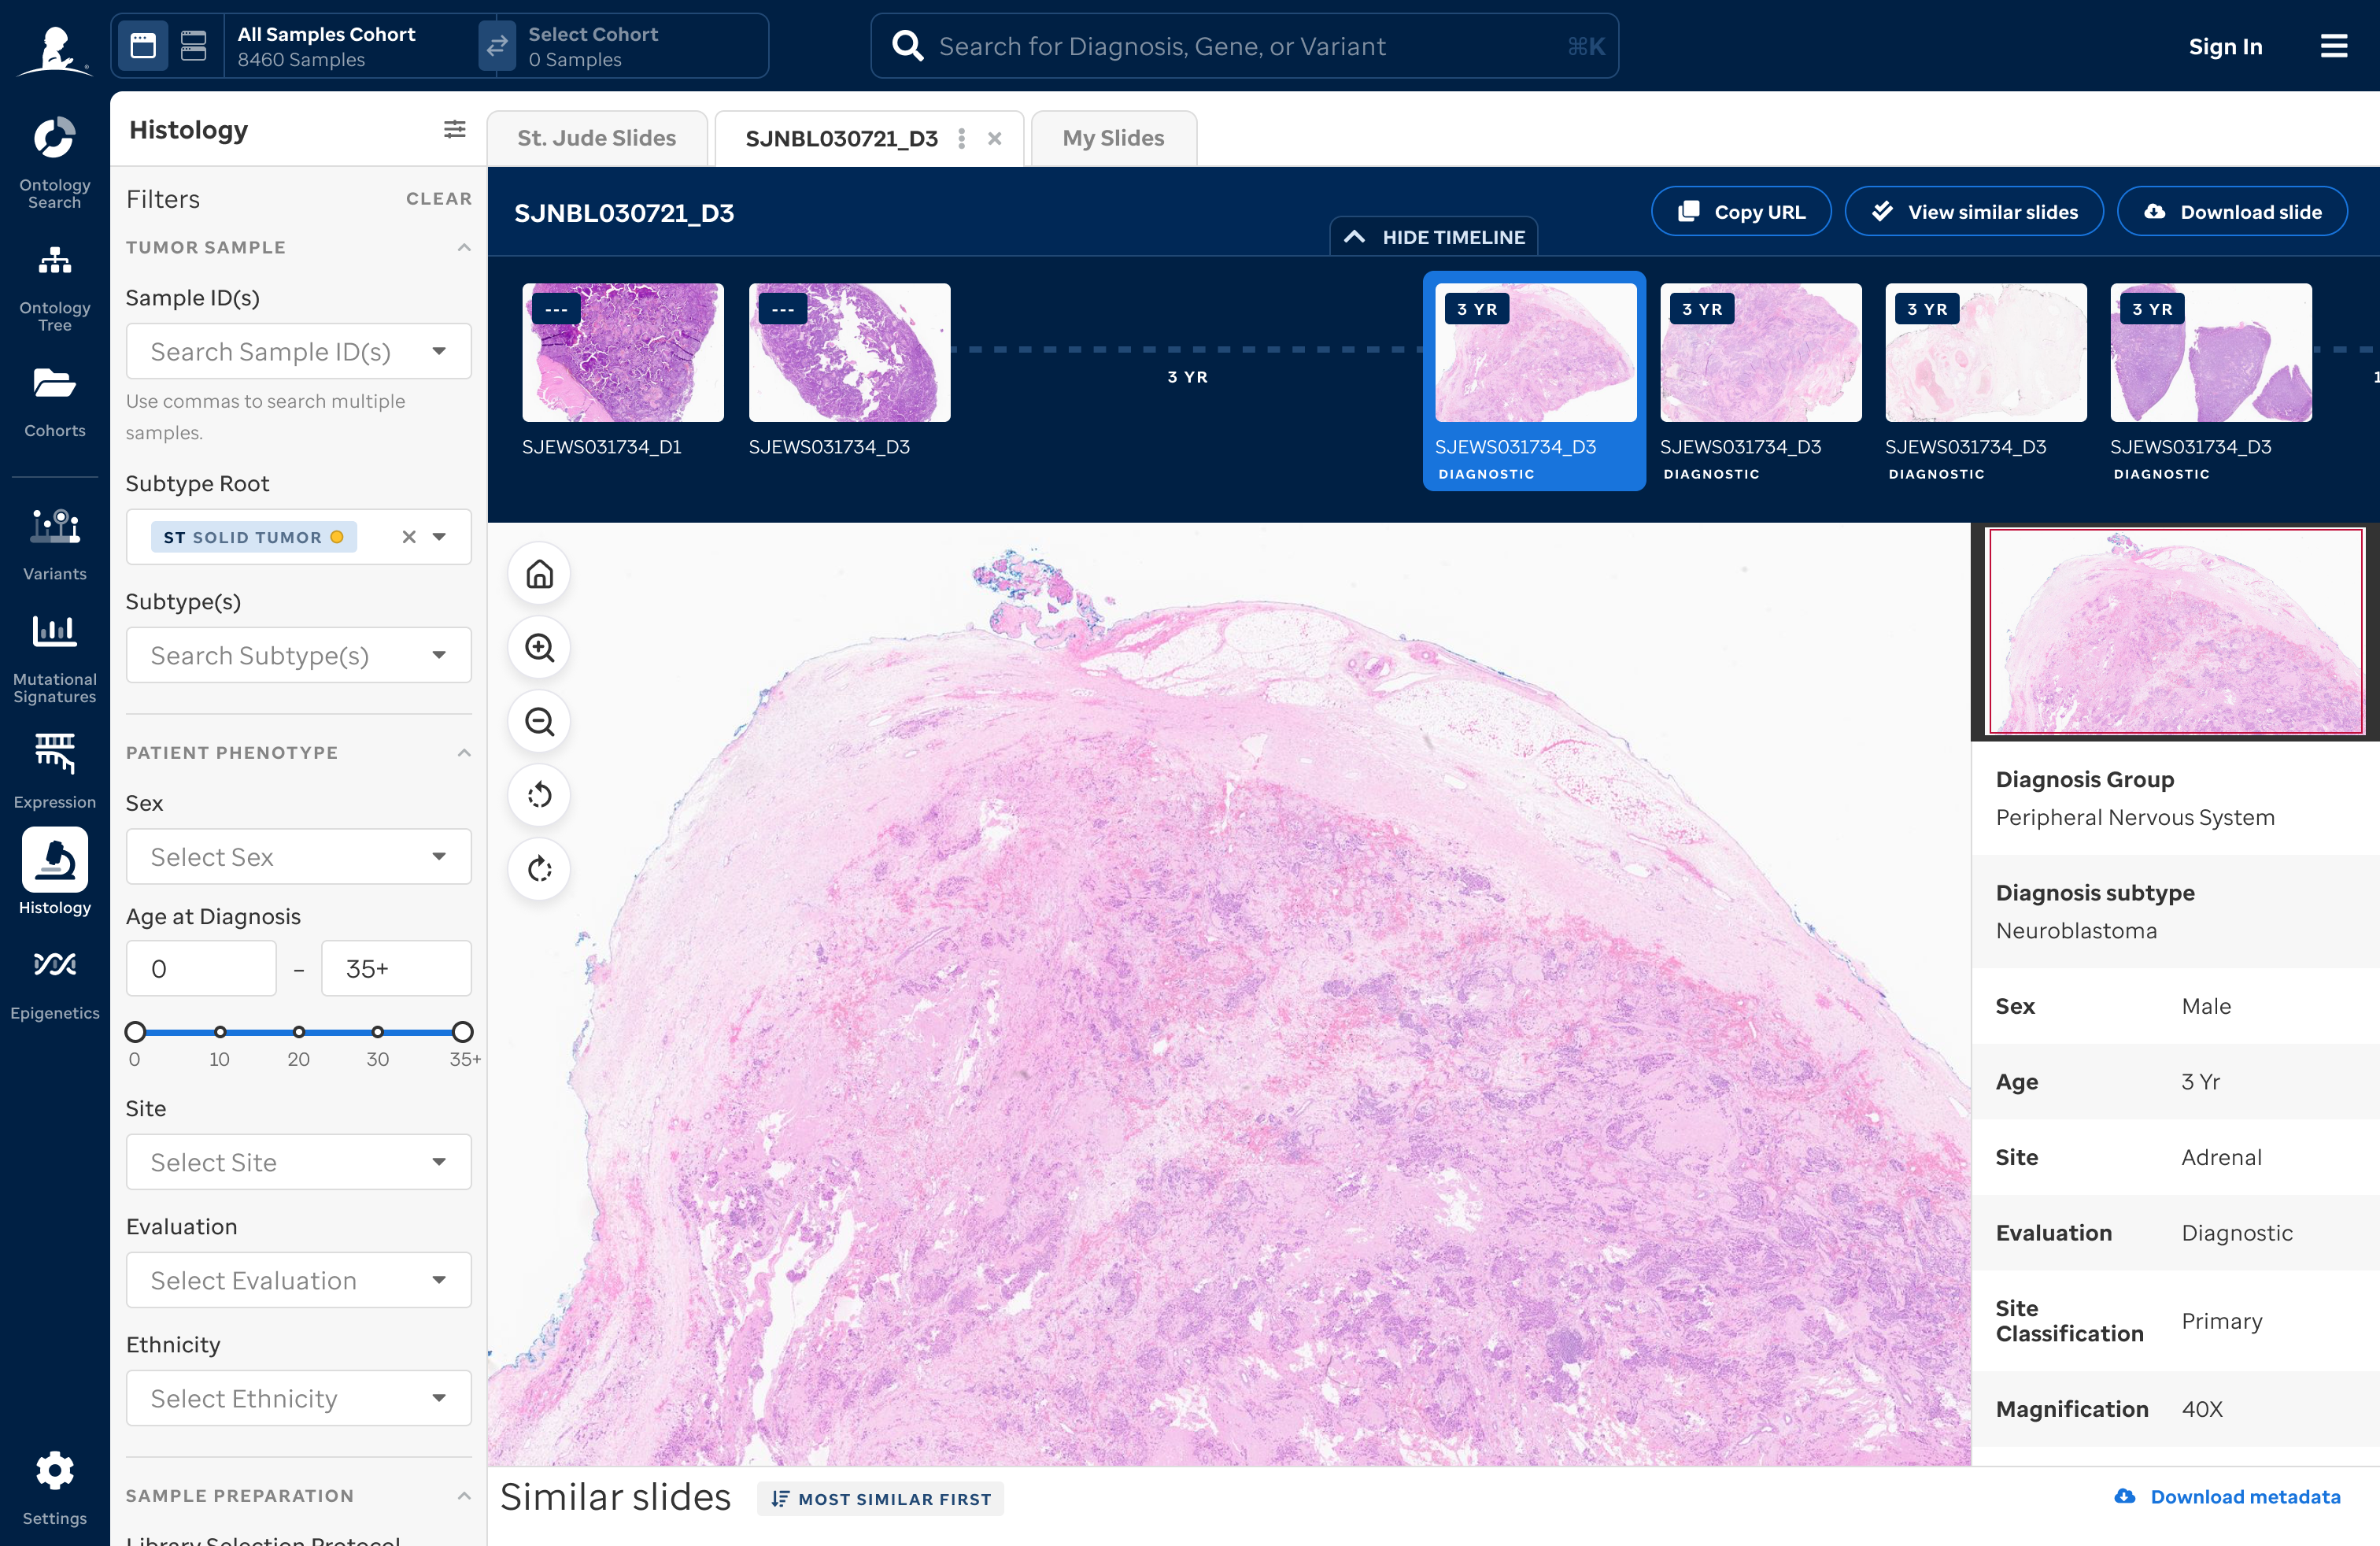 Cohort histology detail
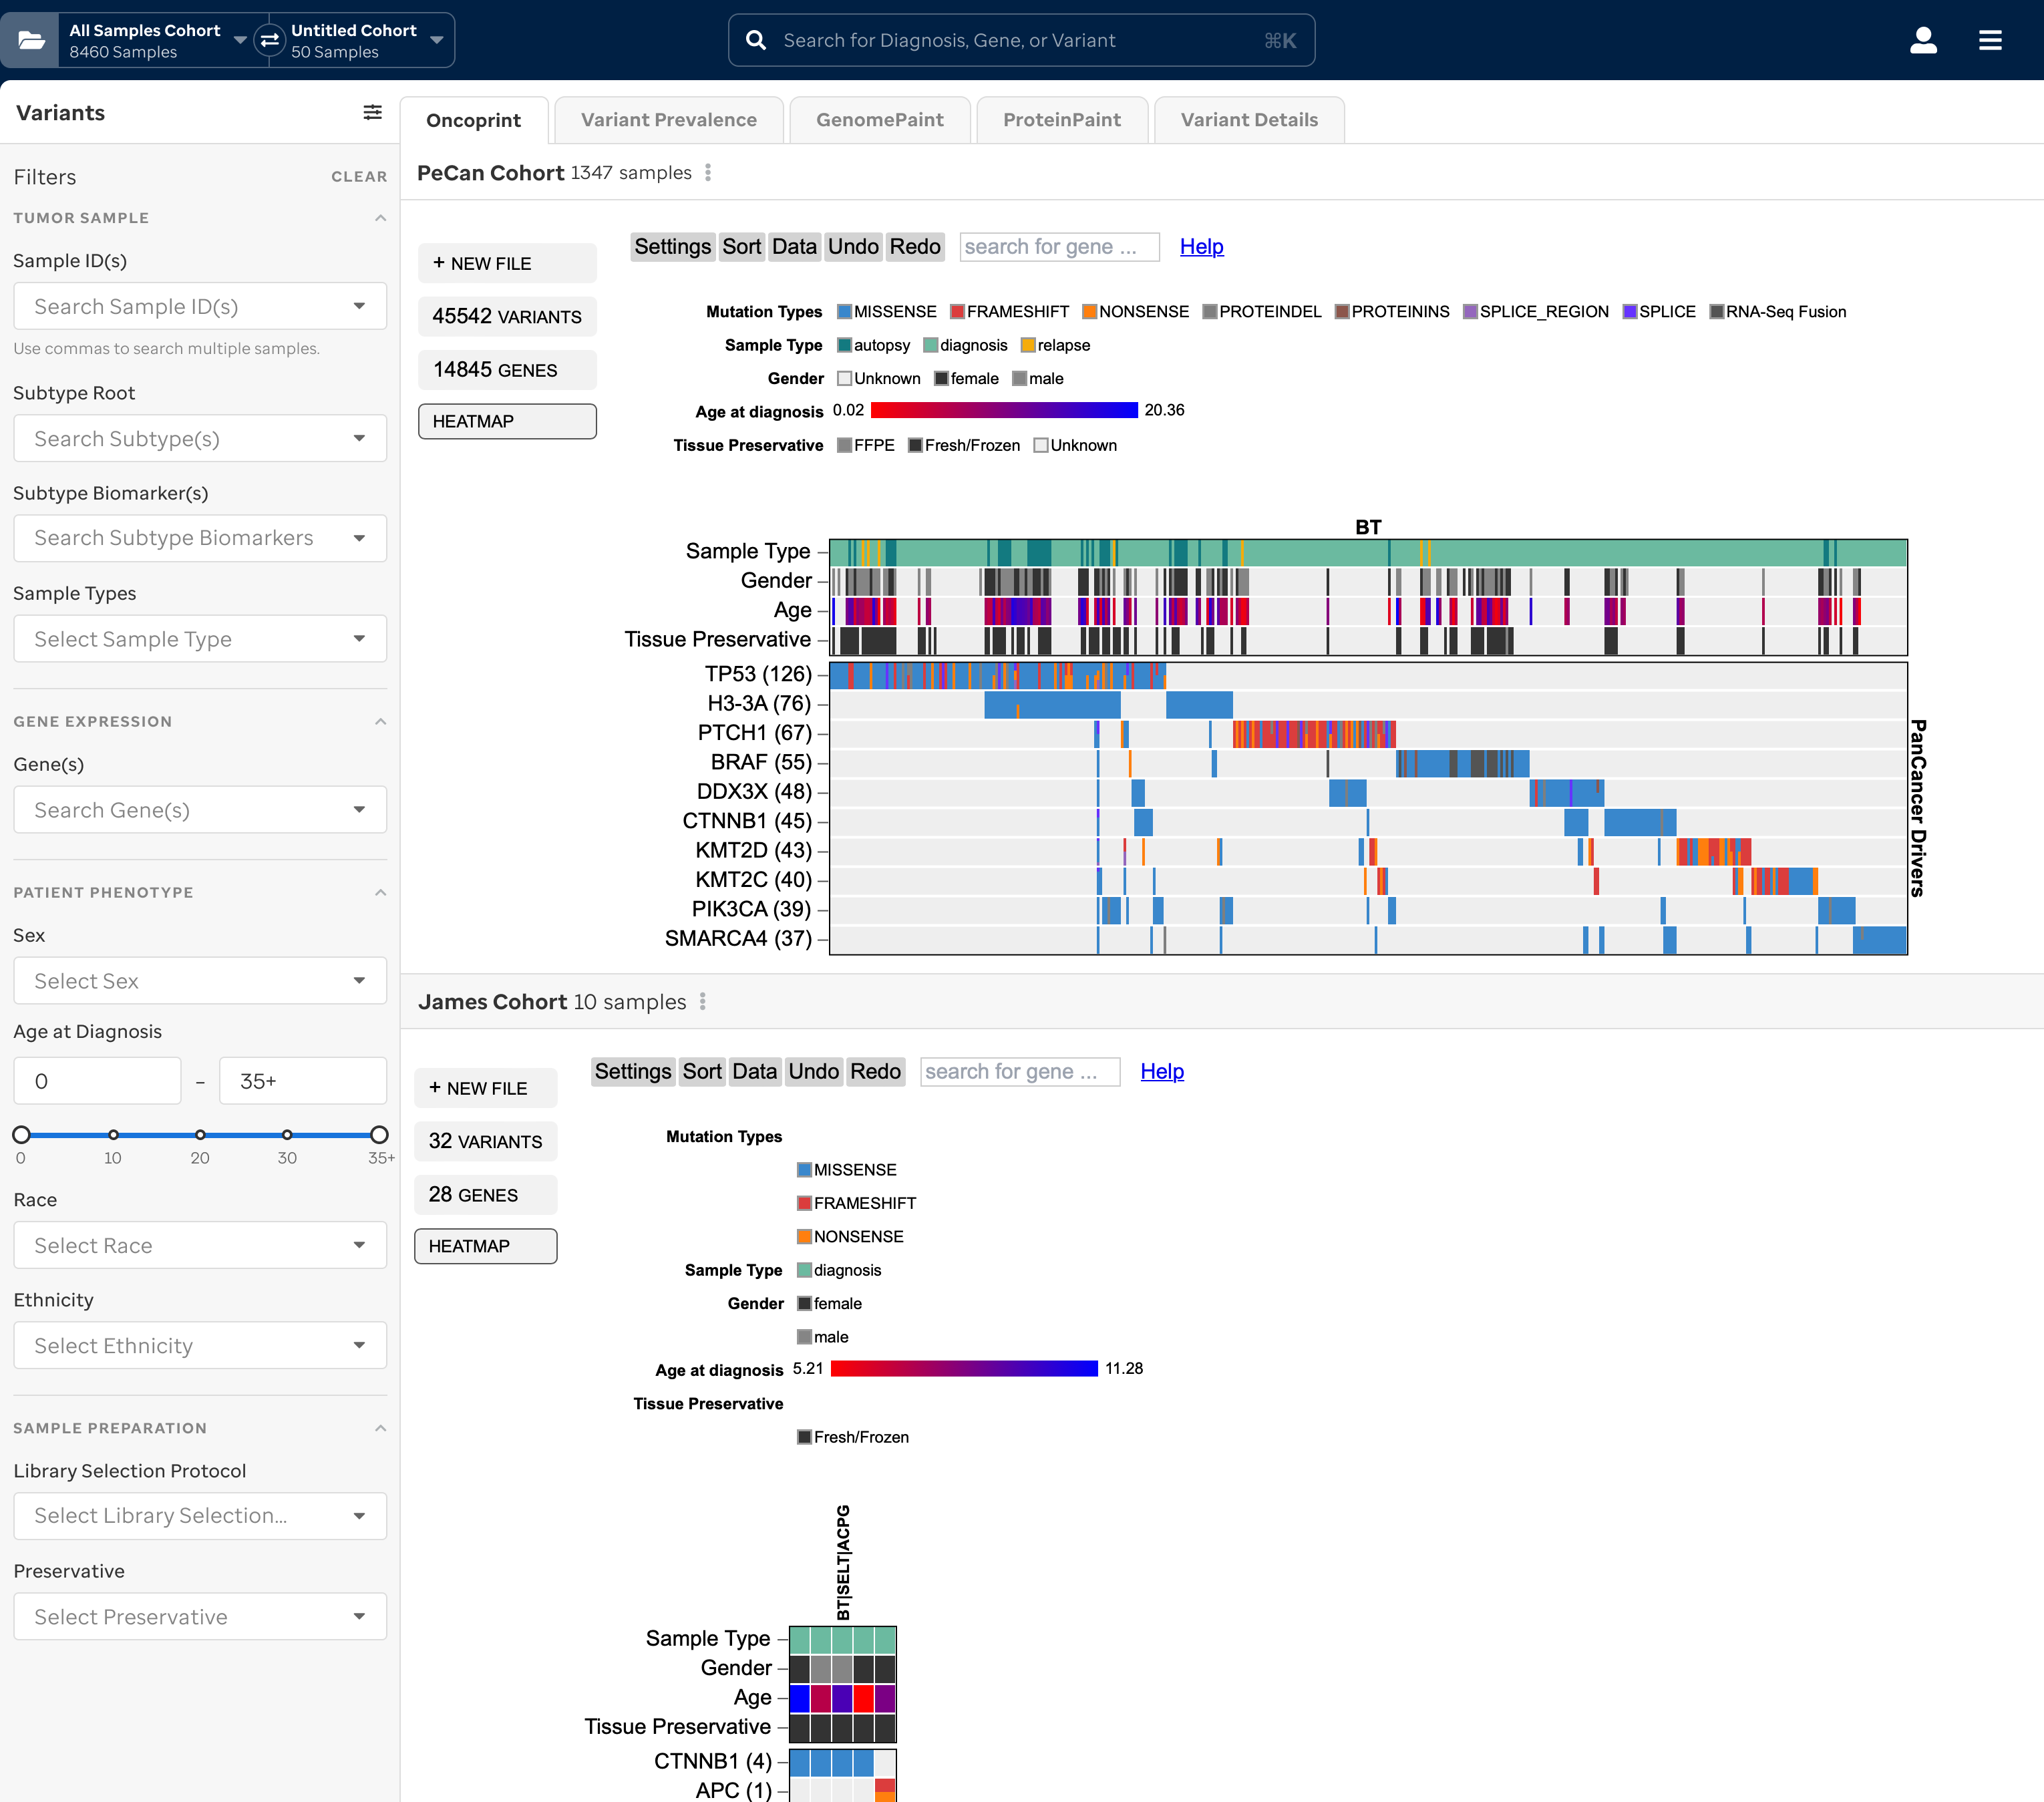
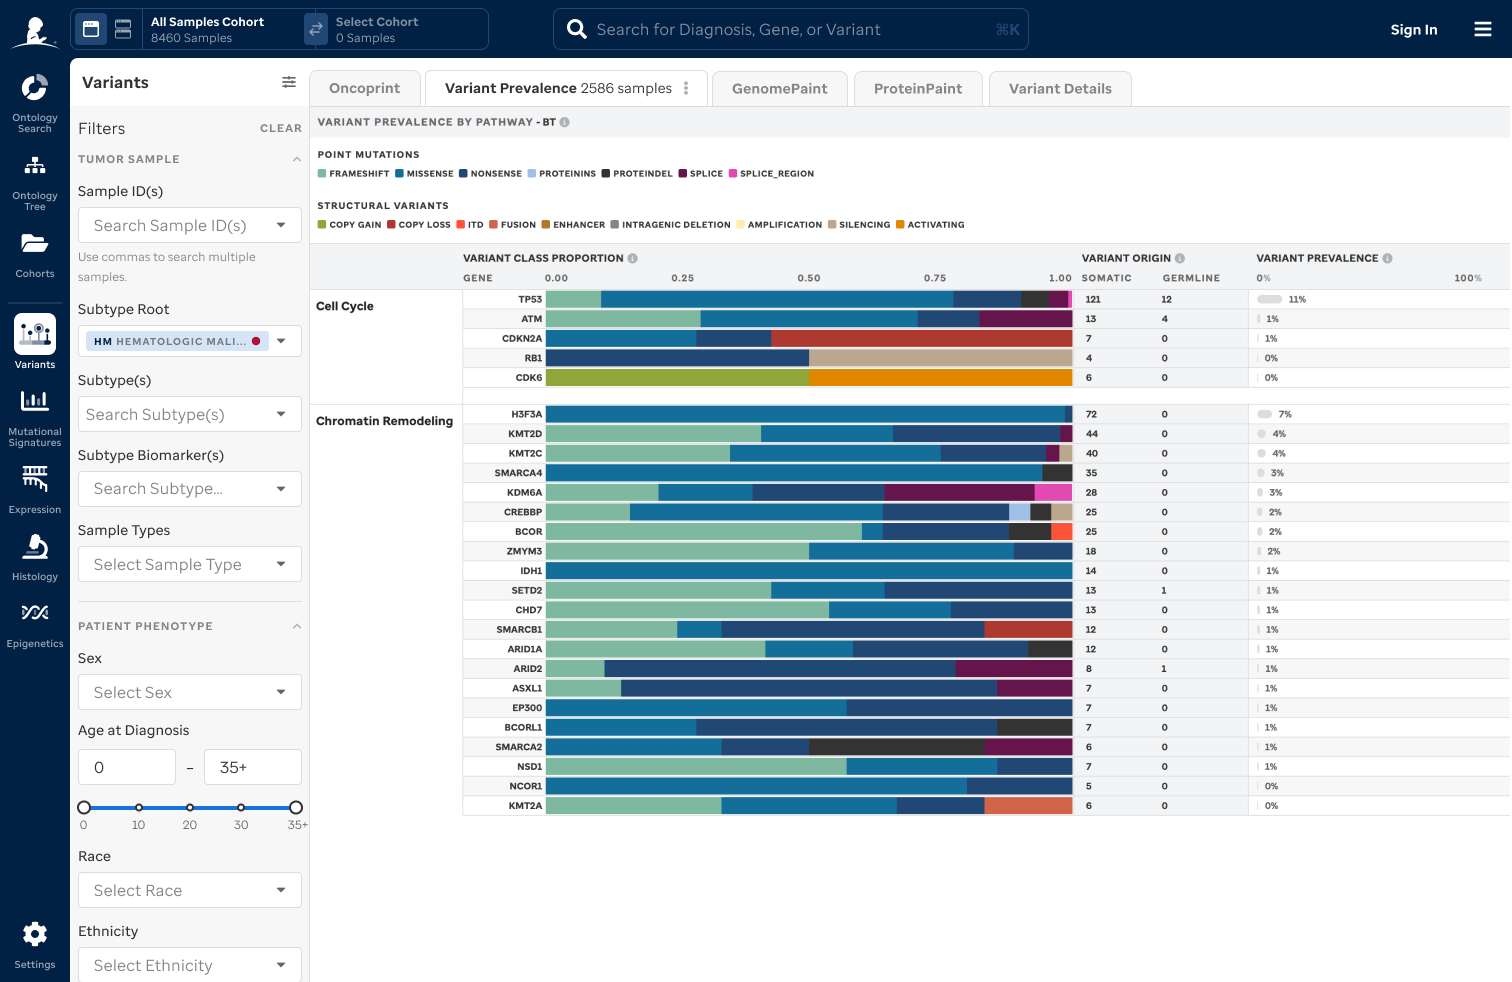 Cohort variants view
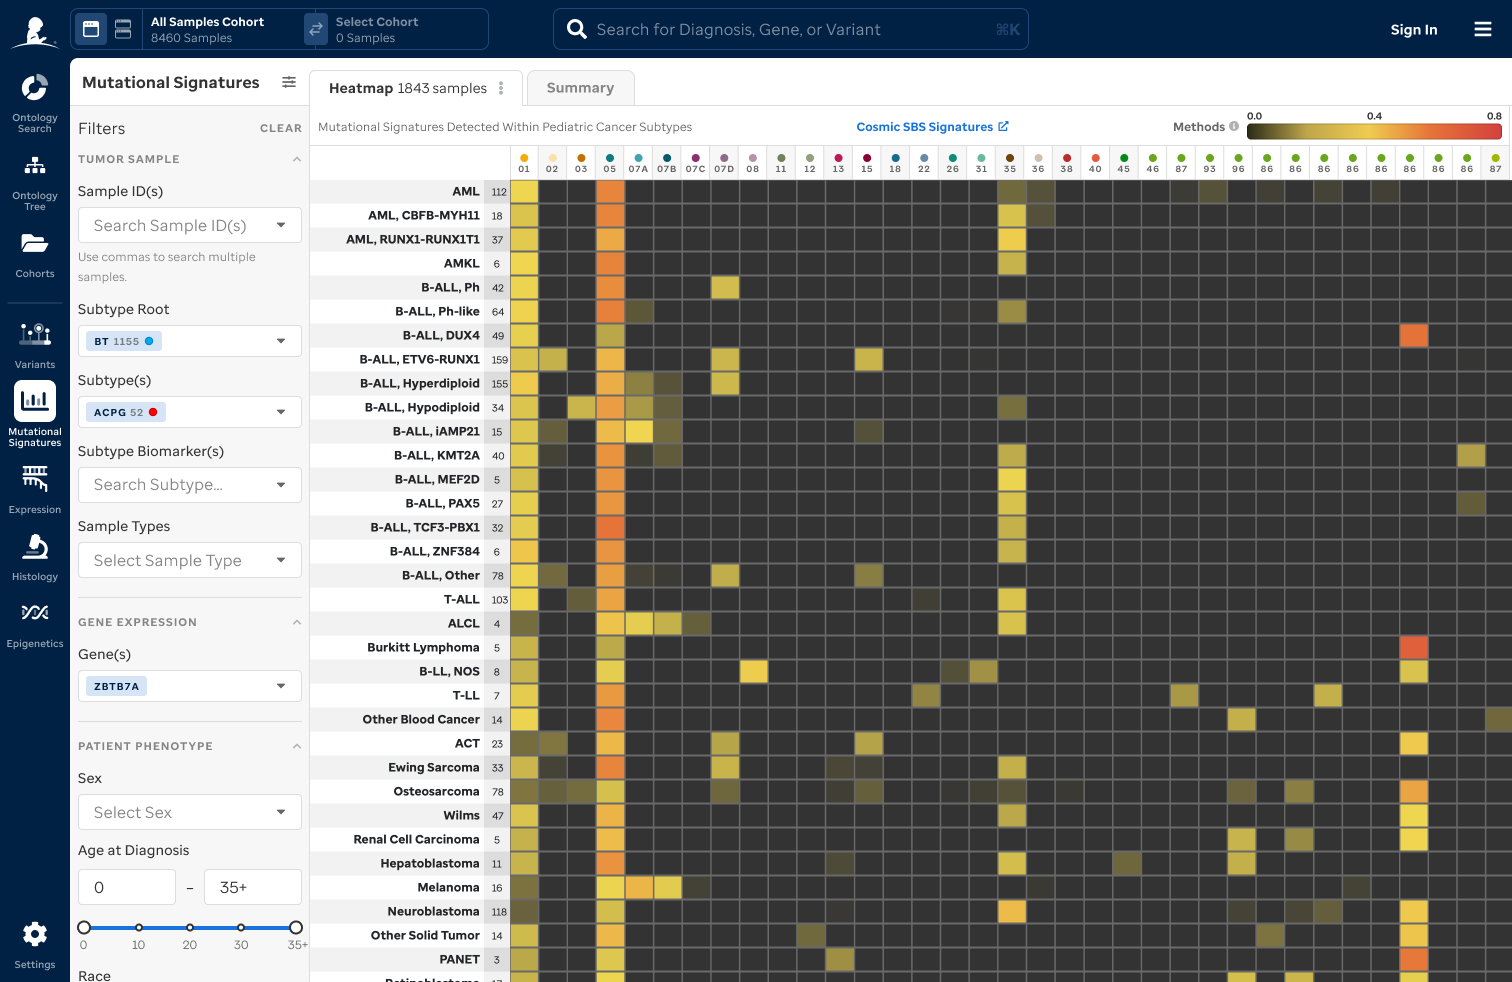 Cohort mutational signatures
Impact
The redesign helped PeCan stand out as a modern research product while remaining cohesive with the rest of the St. Jude Cloud ecosystem. It now serves as an accessible, reliable hub for pediatric cancer data—used by researchers across St. Jude and partner institutions worldwide.
Stronger visual and UX alignment across all St. Jude Cloud tools
Consistent tone and messaging across marketing, product, and documentation
Faster time-to-insight for researchers exploring genomic data
AACR (American Association for Cancer Research) presentation of software and new features
Clearer communication of findings and publications
Cross-department collaboration
PeCan's redesign strengthened St. Jude's broader mission: to share knowledge openly and accelerate cures for children everywhere.
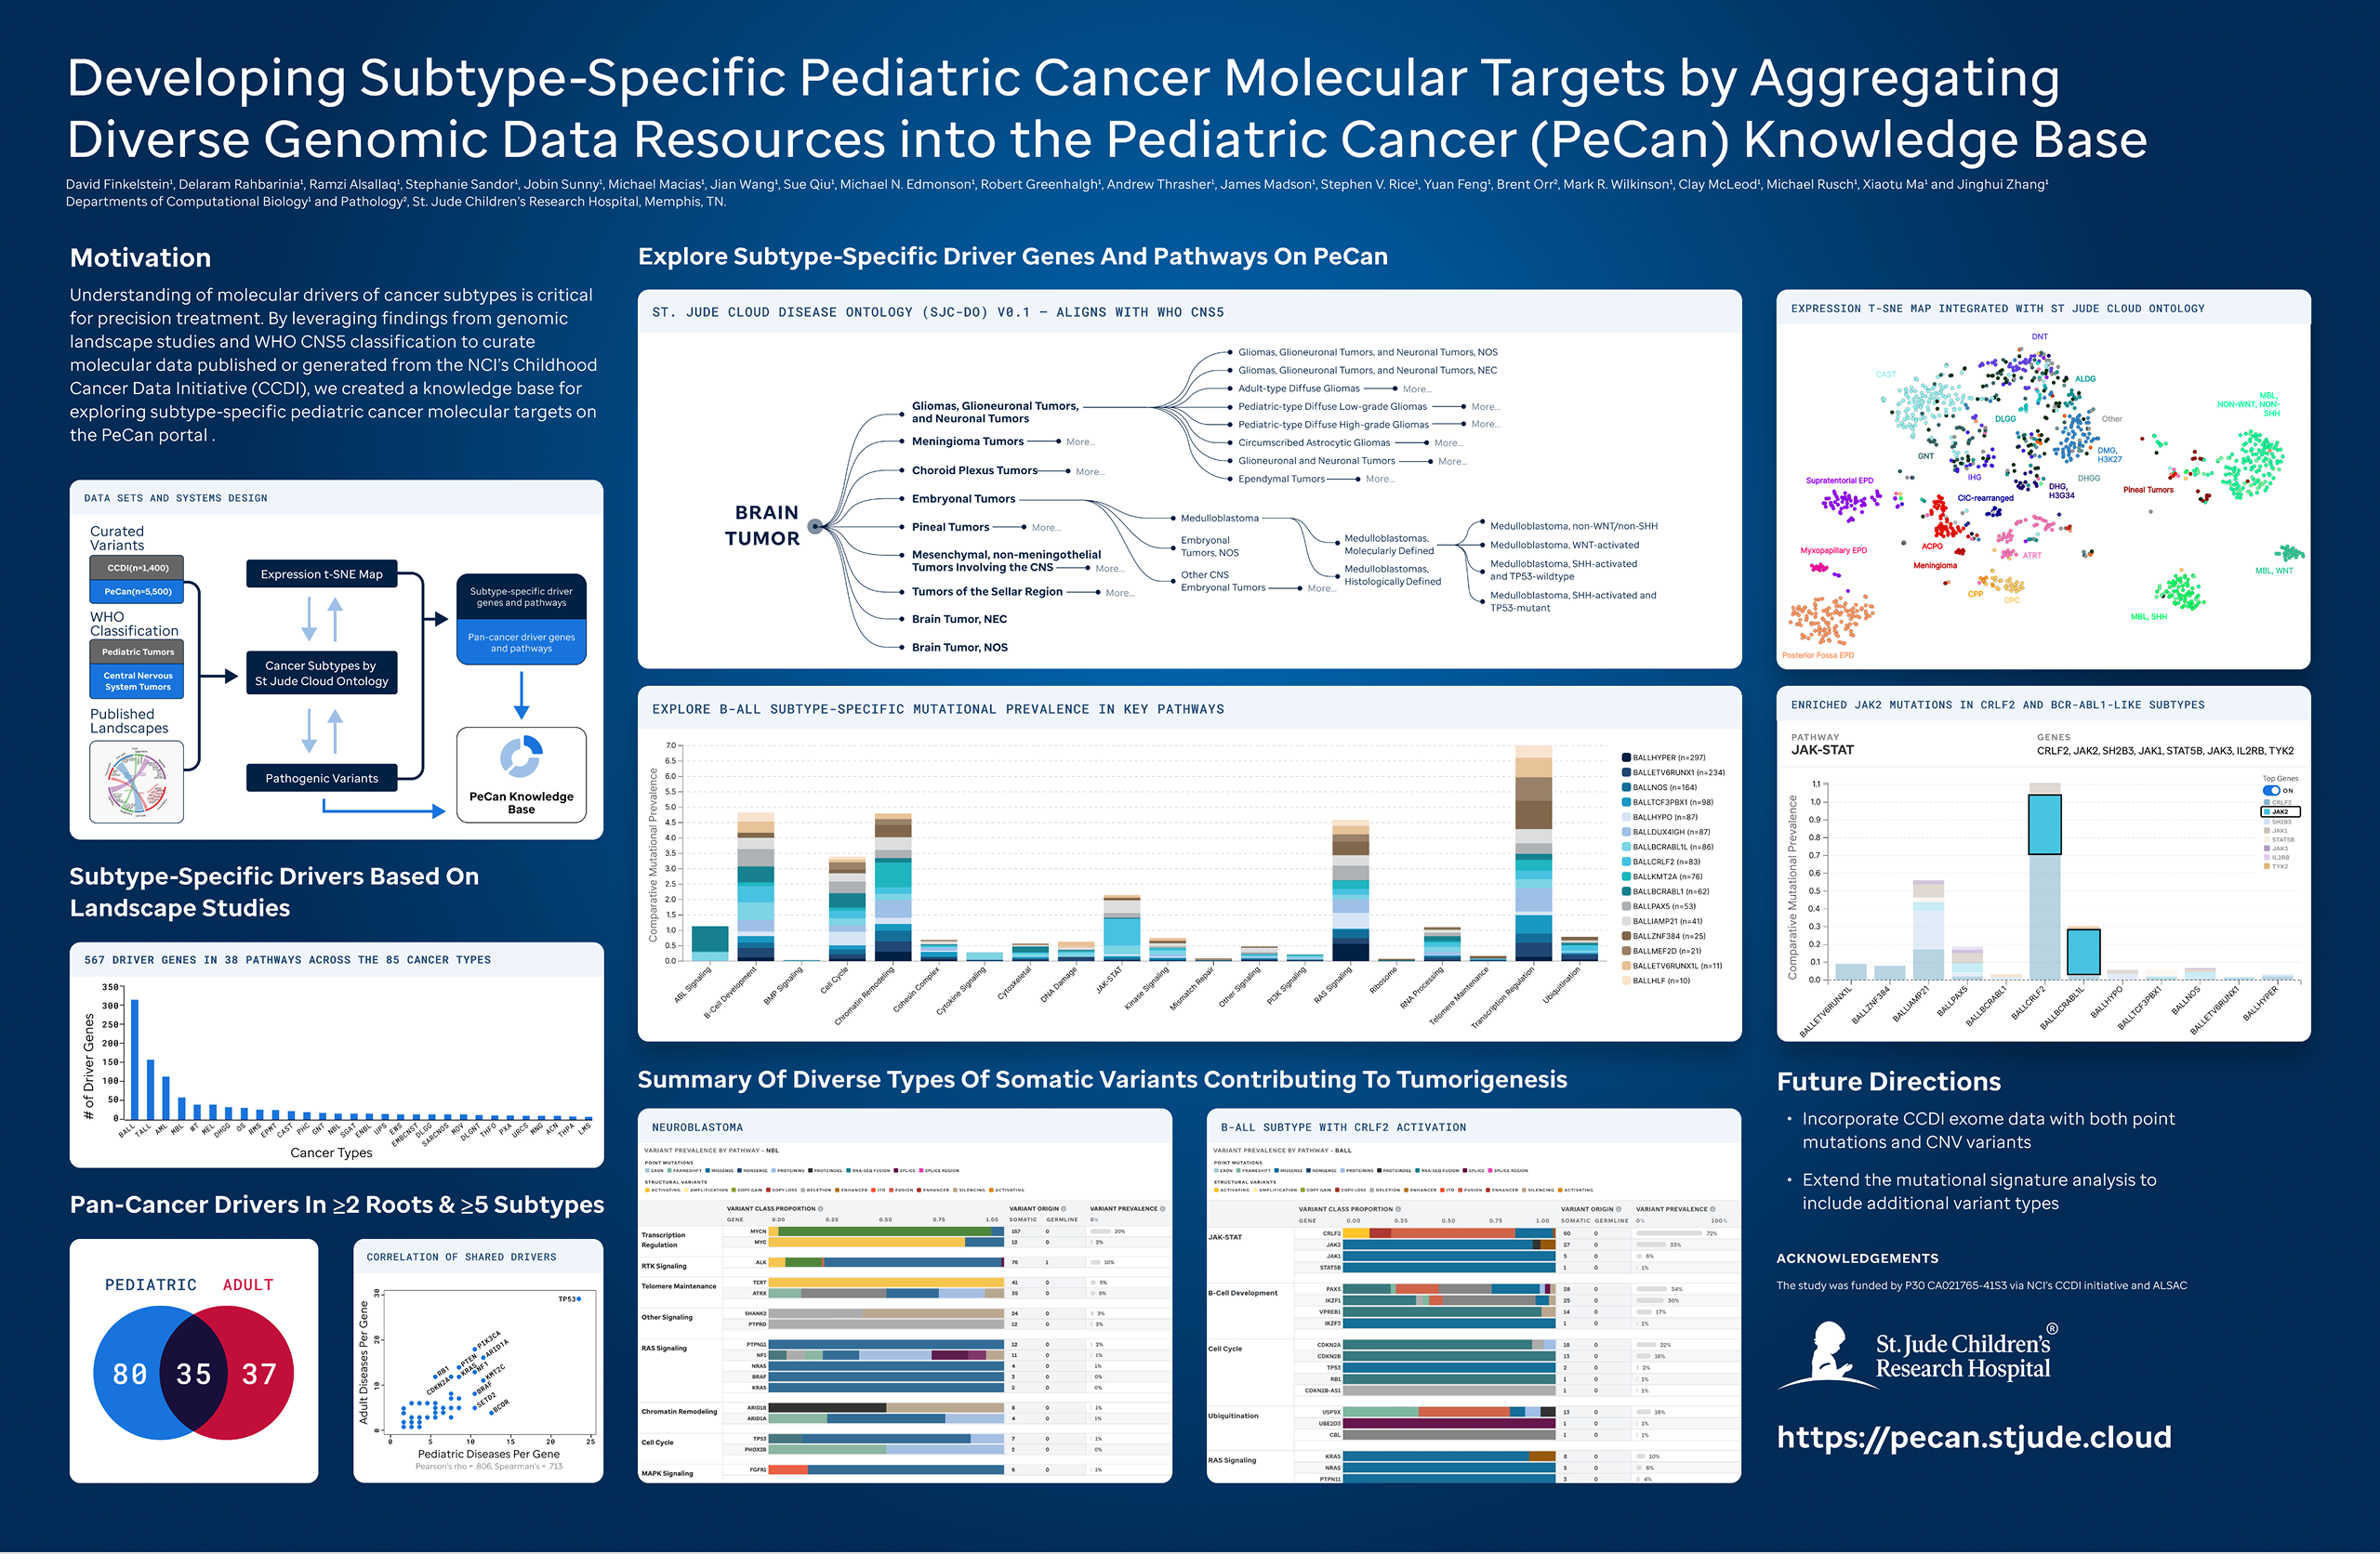 AACR poster design to present new features and findings
Reflection
Designing for researchers means designing for people who know more about the content than you do. That changes the dynamic. You can't simplify data — you can only make it easier to navigate. The right question is always: what does a researcher need to see first, and what can wait?
Working on PeCan also taught me that a design system is only as good as its adoption. Building the components wasn't the hard part — writing the documentation, the newsletters, and the launch materials so the team could carry it forward was what made the work stick.